Bitcoin has been really fickle especially since August 6th. That’s the type of situation in which a very long term chart can help bring clarity. The longest term BTC chart does help a lot as we’ll see in this article. Our 2022 forecasts are underway so stay tuned on our 2022 crypto forecasts.
Bitcoin is the leading indicator for crypto markets, we have said this many times. So a thorough understanding of the BTC chart is crucial for any crypto investor.
- Altcoins have a high probability of creating momentum when BTC is rising or flat.
- However, altcoins have limited upside potential when BTC is setting a topping pattern.
- Needless to say, altcoins are at risk when BTC is starting to fall down.
- When there is bearish momentum in BTC all altcoins will come down.
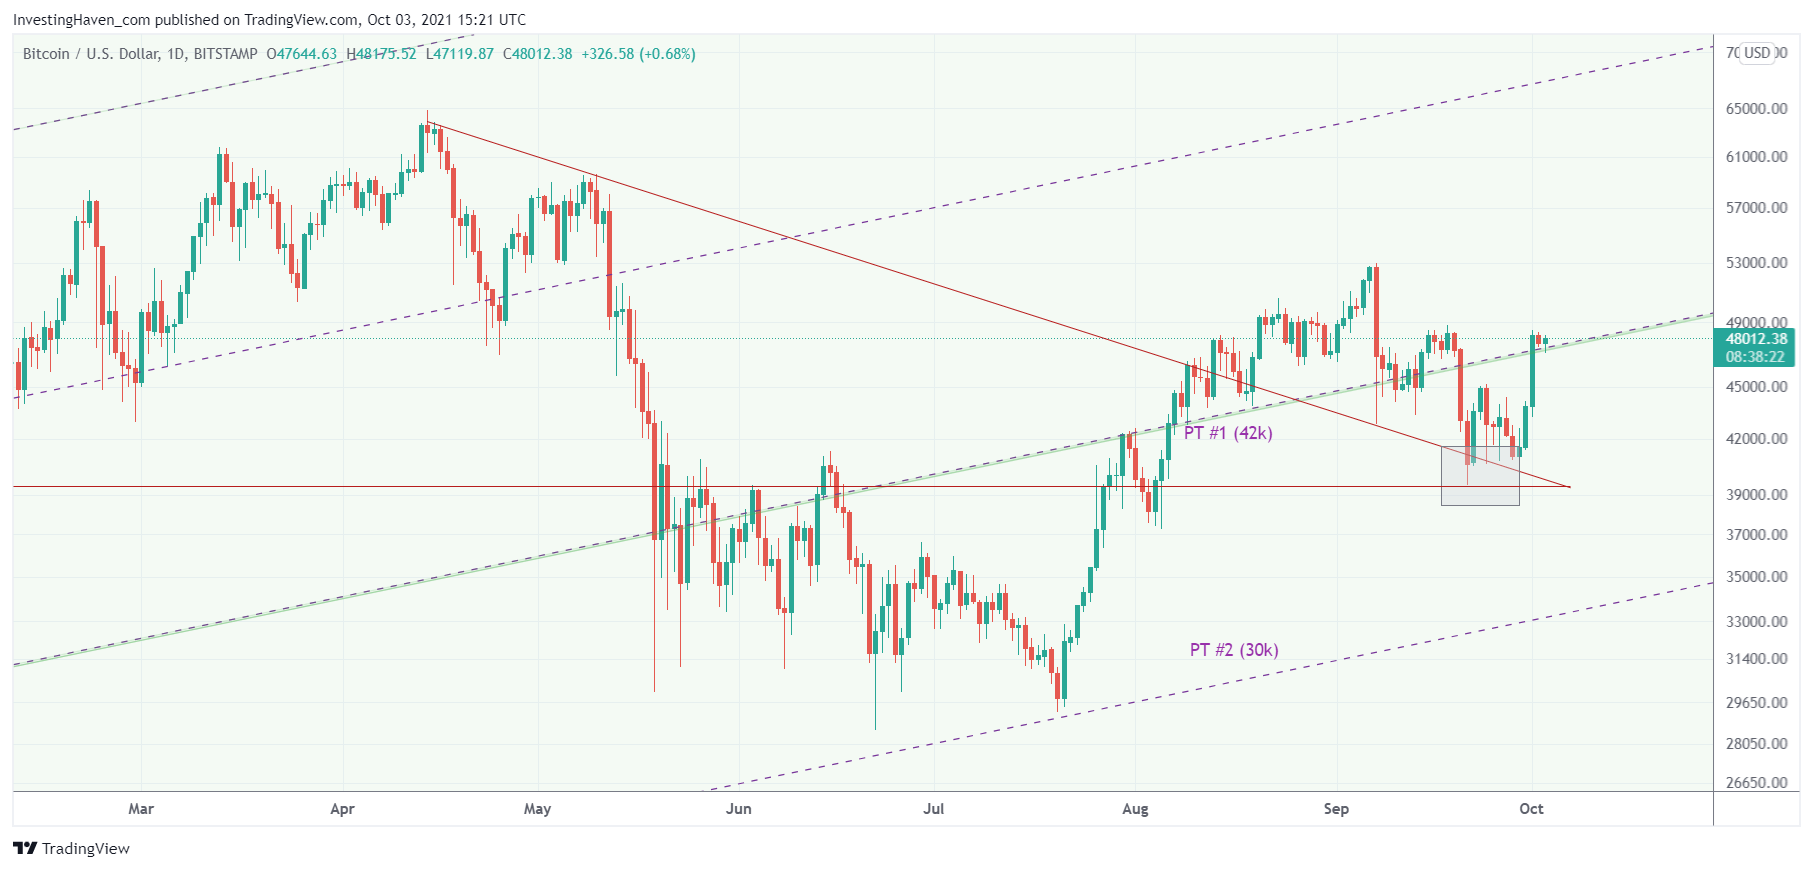
Bitcoin’s daily chart is much more constructive than in September. The September 7th sell-off created good damage on all crypto charts. BTC is trying to recover from this.
The grey box on below chart is the one we indicated to premium members in our crypto investing research service, and we said to closely watch whether that level would be respected. After an entire week of ‘testing’ this level we said to start increasing exposure again earlier this week, and it was another extremely accurate call.
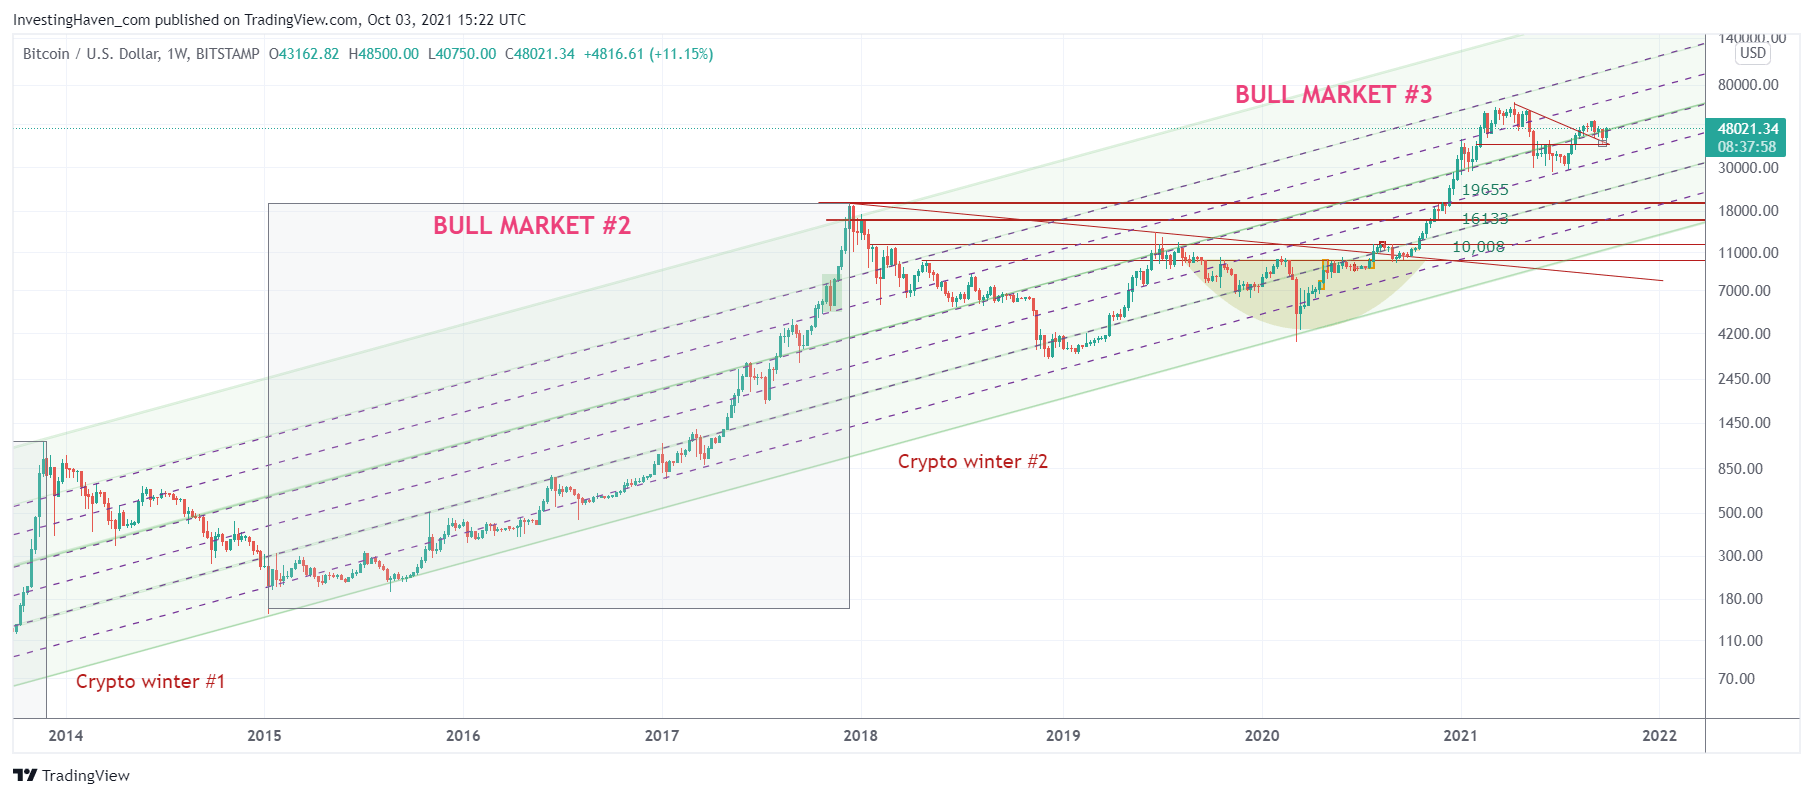
Readers should pay attention to the thick dotted line which is the level where BTC currently trades. It’s the median of a 10 year trend channel, absolutely phenomenal and only visible on the longest term timeframe (below).
This is the weekly BTC chart. It show the current setup in the context of the long term trend. Essentially, BTC is now really halfway, literally. And the period June/July might qualify as a nice reversal whereas the current 3 month cycle (which started on Friday Oct 1st) might qualify as a continuation. More work is required, BTC must respect the 40k level (3 day closing basis) but most importantly the 48k-50k resistance area must be cleared. That’s really imperative, and it won’t be an easy task.
Several altcoins are improving, not all of them though. We are preparing our monthly crypto chart updates to be released late today.
This is the type of analysis we bring to premium crypto members a few times per week, with more detailed BTC charts (leading indicator) as well as altcoin charts which give guidance on when to become defensive vs. when to increase exposure. Crypto market calls are unusually accurate. No coincidence, InvestingHaven is the first crypto investing research service in the world (since 2017).


