Bitcoin, leading indicator for cryptocurrencies, has a chart that is pretty complicated to read. While we believe a turning point will eventually come the question is which levels and structures exactly to track to have a high level of confidence to go long BTC or any other cryptocurrency? We take a closer look at one of the 4 BTC charts structures that premium crypto members received this week. Note, we stick to our 2022 crypto forecast that crypto will be a hyper bi-furcated market.
The BTC chart as shown below is getting really complex. Is this a bearish topping pattern? Is this a bullish W reversal? It’s tough, really tough to dissect this chart and see exactly what is happening. There are quite some patterns, trendlines, and lots of wicks to analyze.
However, we have to simplify things when analyzing charts or markets.
The one and only question to solve as it relates to BTC is which pattern is dominant.
Crypto investors have to track the dominant pattern, and wait for a turning point (reversal) to be printed right at the dominant pattern.
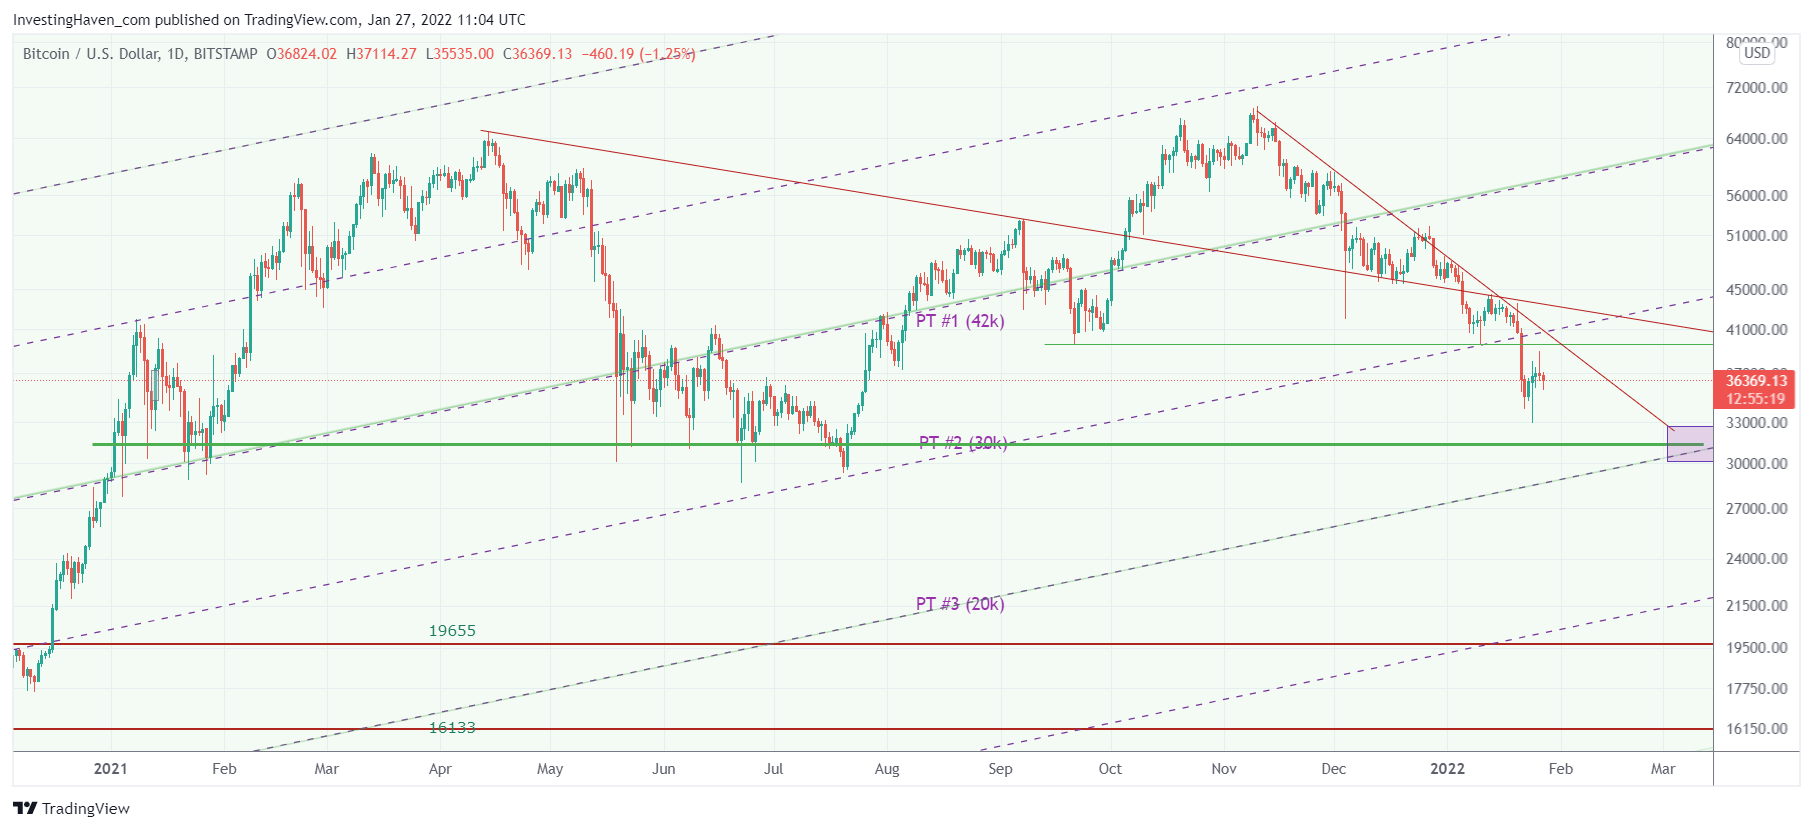
BTC has 2 dominant trendlines: both are falling trendlines, and are indicated in red on below chart.
Although the current BTC chart setup is rather complex we have to simplify the chart. The ongoing decline is dominated by the 2 red falling trendlines visible on below chart.
So, all we are waiting for is a bullish reversal to start, and it must take out both trendlines before BTC can be bullish. Until that happens, any rally will be capped.
If you desire more detailed BTC and altcoin charting and trend analysis we invite you to join our premium crypto research service.


