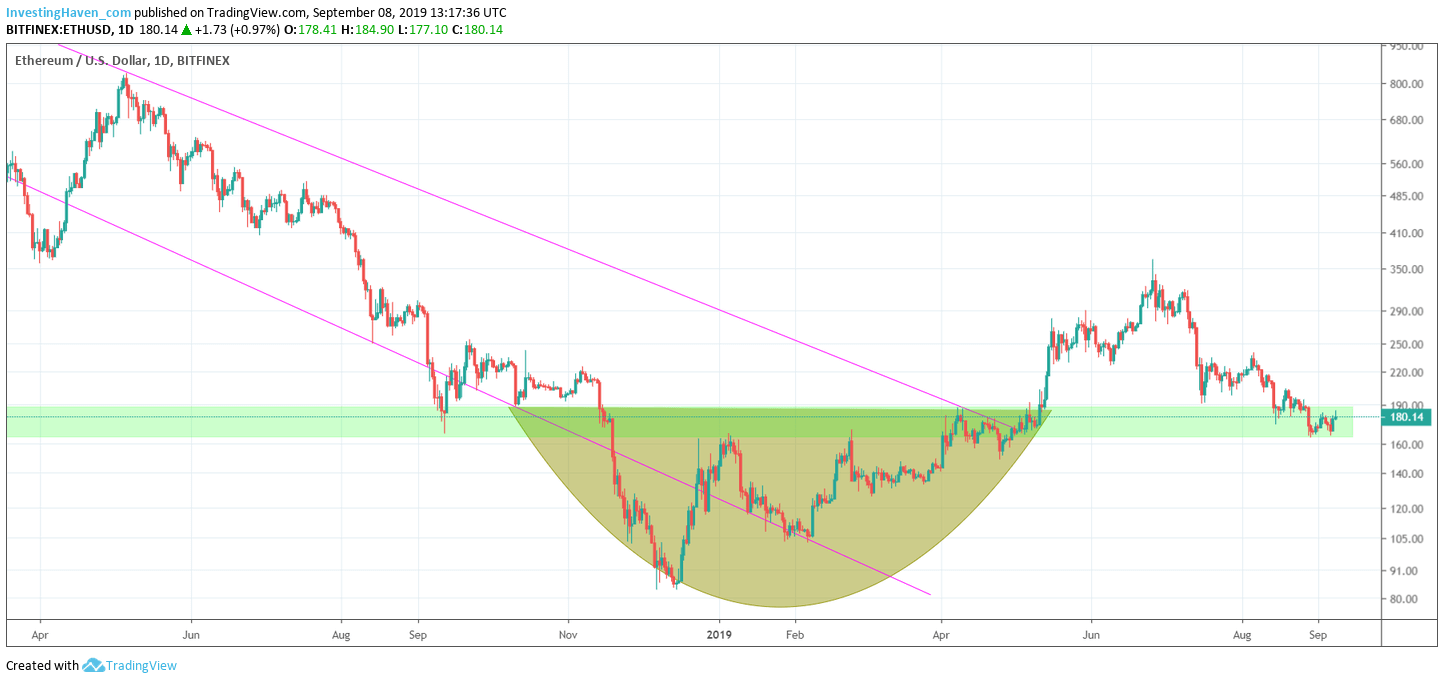
The daily chart of Ethereum has one very interesting insight: former resistance of 2019 has now become support. We acknowledge that most ‘chatter’ on financial and social media is about ‘news’, price changes and short term chart pictures. That qualifies under reading materials and entertainment. It certainly does not help investors come to better investing decisions. What does matter is finding the ‘right’ insight from the ‘right’ chart setup. Ethereum, specifically, signals potential strength at this point in time. However, it needs more bullish energy to confirm its bull market. That’s why it will be crucial, not only for Ethereum but for any altcoin in the crypto space, to have Bitcoin break out from its 2.5 month consolidation period. We expect this to happen any time soon as said in our piece about the crucial days for Bitcoin. It will be the basis for our Ethereum forecast of 550 USD in 2020.
Ethereum trades exactly at the same level as when the crypto market broke out on April 2nd, 2019. That’s when we wrote Bitcoin & Crypto: Bear Market Officially Ends Today, Bull Market Officially Starts Today.
In essence, since the major breakout of the crypto market on that date, several altcoins, Ethereum included, went up sharply only to come back down and test their breakout levels.
We see this major rounding bottom on Ethereum’s price chart followed by the breakout in April. There was a violent rally afterwards and a retracement in the last 2 months. We now see a stabilization right at major support which was the resistance area of the rounding bottom.
It is liquidity in the crypto market that will support Ethereum to not only respect support but also push it to our projected 550 USD in 2020. Liquidity will come from Bitcoin.
In the end altcoins and Bitcoin are part of the same asset class, whether we like it or not. They will move in tandem up but also down.


