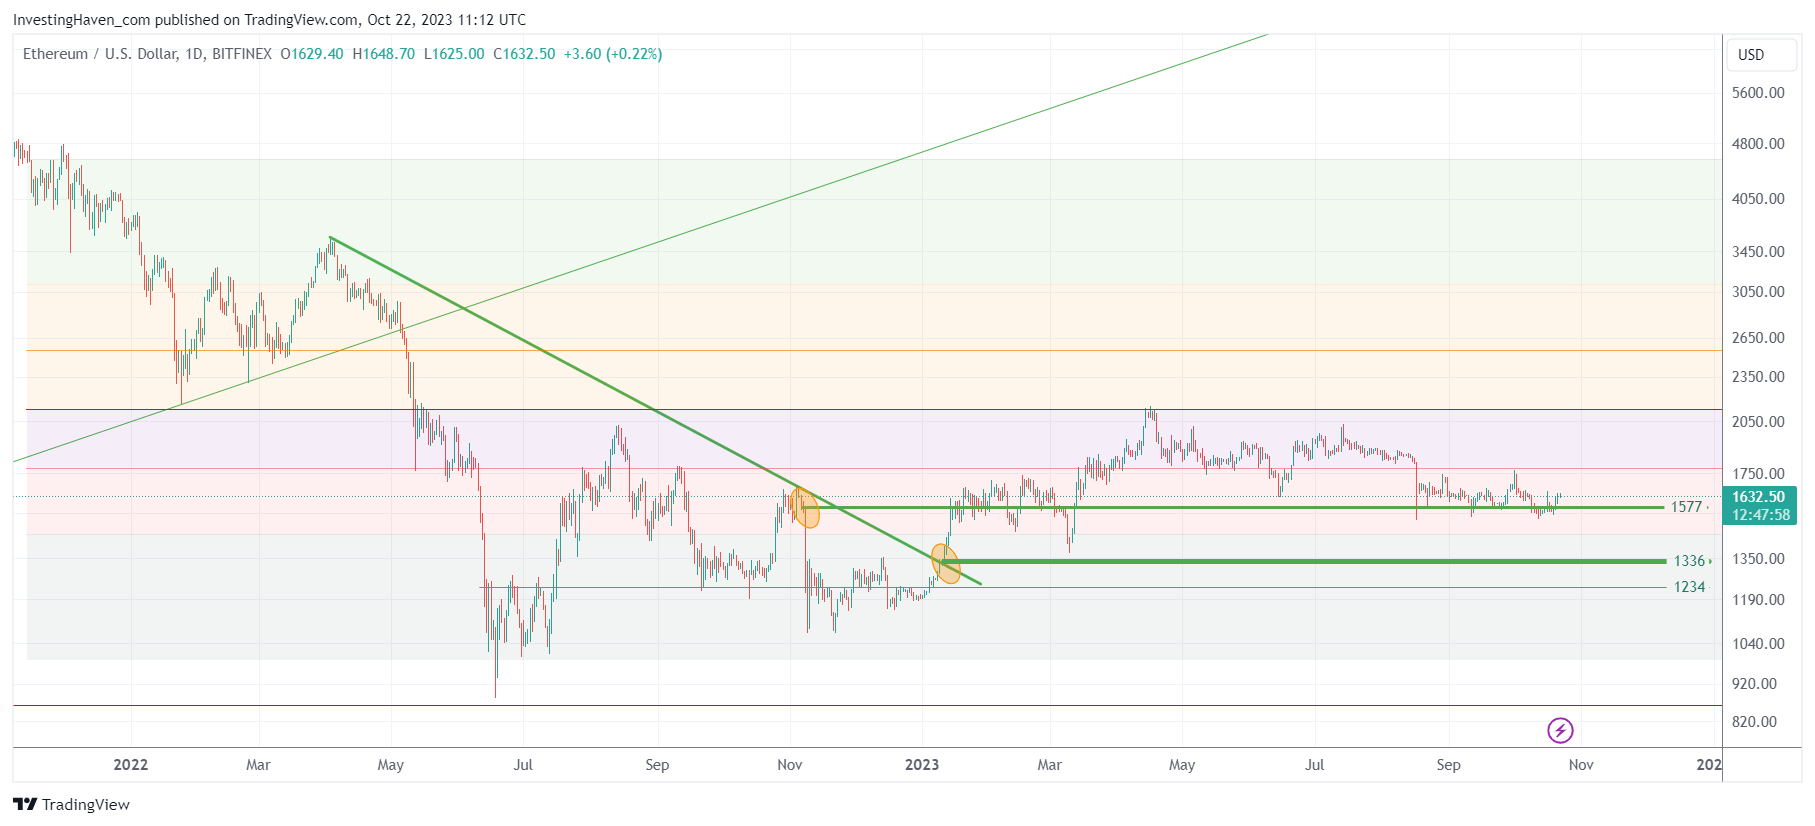
As an investor, it is important to differentiate bullish from bearish outcomes. Sometimes, this might require predicting an outcome (which tends to come with a forecast). However, sometimes it is really as simple as defining the ‘line in the sand’ in terms of price or time. If we apply this general principle to Ethereum, it is so simple to find the ‘line in the sand’ that it may seem so obvious that it escapes our attention. ETH will be bullish in 2024 as long as it respects 1550 USD on a 5-day closing basis, it’s as simple as that.
From time to time, we need to keep charting as simple and obvious as possible. Ethereum in 2023 and likely also in 2024 is a prime example of this guiding principle.
The chart of Ethereum, otherwise very volatile, became an easy read lately as ETH entered a trendless state.
- We would pick 2070 USD as the ‘breakout’ level. This is easy to remember as it’s the ATH price of gold. In Ethereum terms, it is the 50% retracement level of the decline that started in November of 2021, with a bottom set in June of 2022.
- When we carefully analyze the Ethereum price chart, we can find 2 more important price points, other than 2070 USD. On the one hand, we find the start of the mini-crash in November of 2022 (FTX implosion), it started when ETH was trading around 1600 USD (see yellow circle). The other important price point is the point in January of 2023 where ETH cleared its 10-month falling trendline (2nd yellow circle), around 1330 USD.
- The lows set in 2022 was 1000 USD.
While we can spend a lot of time predicting Ethereum’s next price move, we can also keep it very simple: ETH bottomed at 1000 USD, it has an epic breakout level (resistance for now) at 2000 USD. The two levels that really matter, as outlined above (also visible on the chart, yellow circles) are 1330 and 1600, so that’s 30% and 60% in the range 1000-2000.
For 2024, we will keep it very simple: as long as ETH can respect 1550-1600 USD, on a 5-day closing basis, it is trading in an area with a bullish bias, able to quickly move to 2070 USD to start a breakout attempt, on bullish momentum in the crypto market.
Below 1330 USD it will become very vulnerable unless 1230 USD holds. In that scenario, it might be that ETH will be working a long term bullish reversal in the form of a double bottom.
Needless to say, below 1000 USD, in 2024 or beyond, it will be bearish for Ethereum.
We believe that ETH will respect 1330 USD in 2024. We also believe that ETH qualifies as a lower risk play in a high risk crypto market. In our premium crypto service, we identified a few bullish setups that might provide leverage whenever bullish momentum returns in the crypto market, as outlined in 3 Top Cryptocurrencies For November 2023.


