InvestingHaven’s research team was the first in the world to publish cryptocurrency forecasts. InvestingHaven’s research team was the first in the world to publish a public crypto investing research service to guide crypto investors. Our Bitcoin forecast for 2020 is very bullish, more importantly our XRP forecast for 2020 is ultra-bullish. Still many try to look for chart patterns that do not exist, especially pseudo-gurus on Twitter that focus their energy on acquiring likes and followers. They publish chart patterns, and take themselves seriously, like the ones in this article. Bitcoin has indeed a very, very scary chart setup. Tiny detail: these scary charts would be extremely concerning, but only if they were for real.
It is amazing what news does to investors. Nowadays everyone and his uncle can publish financial news, forecasts, predictions, and as long as it somehow ‘fits’ the endless stream of ongoing news (as in: the ongoing sentiment) people also tend to believe what they read.
One of the most interesting things we have noticed is the art to draw a chart (pattern).
With the many charting tools currently available it becomes easy to draw all sorts of patterns.
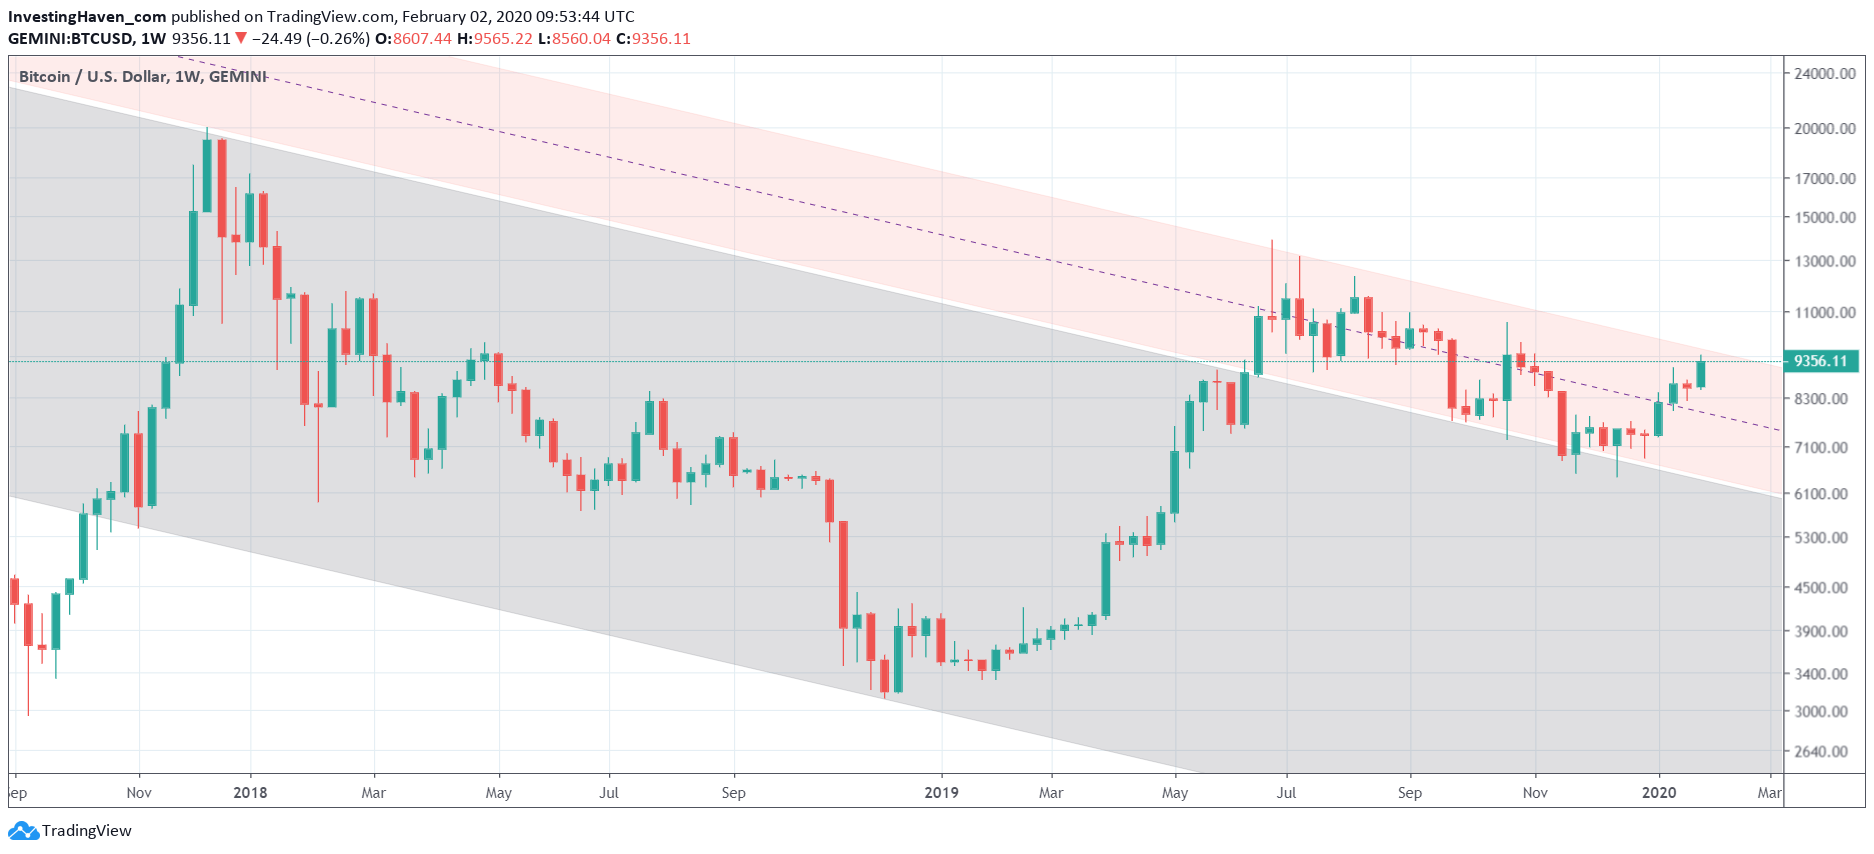
Look at the Bitcoin pattern below. Pretty scary isn’t it? I mean who on earth dares investing in this thing called Bitcoin after checking below chart setup?

Well we have news: if the above chart was respecting chart pattern analysis rules it would indeed have been extremely scary. However, it’s the type of ‘connect-any-point-with-any-line-as-creatively-as-possible’ chart setup.
Charting is something totally different. It’s not about playing around with tools until you were able to draw a pattern that looks ‘good’ and can create buzz on Twitter.
Charting has rules, do’s and don’ts. It needs validation from a multitude of factors. One such factor is the top down approach: multiple timeframes need to confirm a setup.
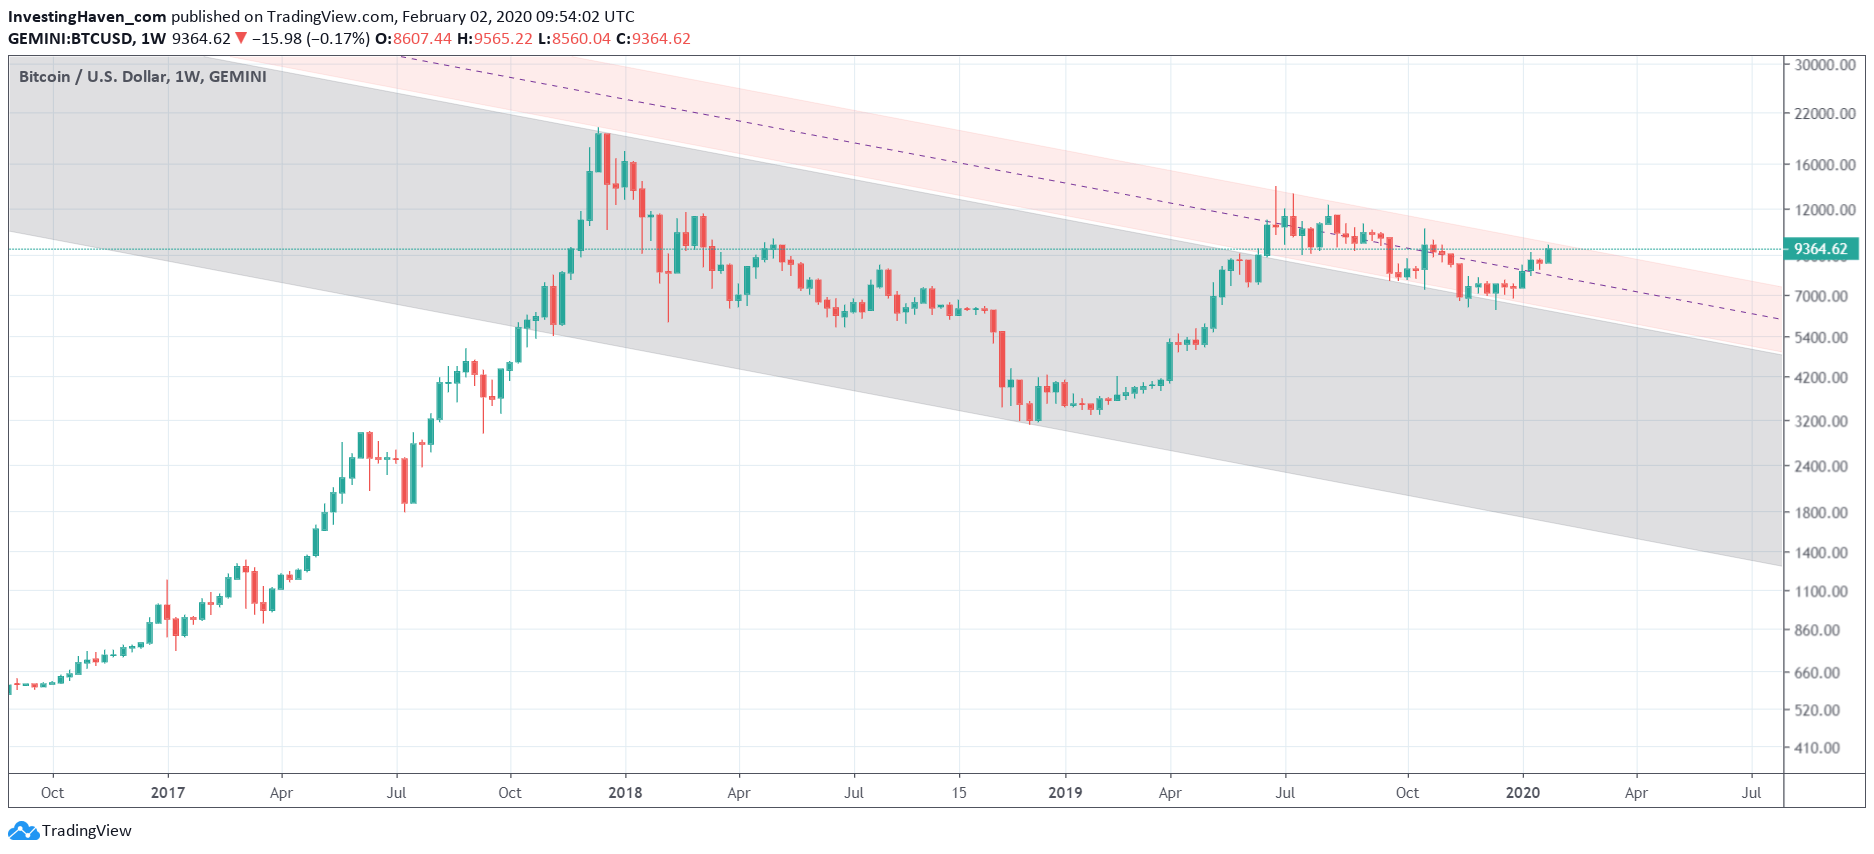
If we apply the above chart to a longer timeframe we see that the setup does not make sense whatsoever. There is no confirmation.
Any astute reader would already have noticed several red flags on the first chart above, especially looking at candlesticks.

The clue of this story and these charts is that these chart patterns are not valid. It’s what you find in the wild wild west of financial content. They will lead to horribly wrong investing decisions.
Consequently the title of this article is misleading, just to contrast with our real ultra bullish stance against the crypto market which is on the verge of a giant breakout. Especially XRP is breaking out today: XRP: Giant Breakout Starts NOW: The Must-Hold 10-Bagger In Any Crypto Portfolio
The point we are trying to bring across is that you have to be *extremely* careful looking at charts, especially from the pseudo-gurus out there (there are many of them in the crypto space).
They were all so convinced about Bitcoin’s continuous fall on Dec 15th, 2019. Shorting Bitcoin was the consensus trade. That was the day that OUR charts said that the bull market was still at play, and we showed all the charts with annotations in great detail to our premium crypto members. They got world class guidance from InvestingHaven’s research team.
Today we are on record calling for a powerful crypto bull market, and members from our crypto investing research service received a detailed strategy on January 13th, 2020 on how to play this. Yes we were early, again, and the market is proving us spot-on yet another time.
And above all our charts were proven to be spot-on, as accurate as can be, not seen anywhere else!
Want to have access to our 2020 crypto strategy? Sign up here, go to the crypto alerts section and look for the alert sent on January 13th, 2020. You’ll get instant access, and you will still have an edge even though you are more than 2 weeks ‘late’.


