Investing Haven
No Result
View All Result
Gold Silver Investing >>
CRYPTO INVESTING >>
  • 2025 Forecasts
    • 10 market predictions
    • Dow Jones forecast
    • S&P 500 forecast 2025
    • Nasdaq prediction 2025
    • Best altcoins to buy
    • Best crypto to buy now
    • Which crypto will explode
    • 15 crypto forecasts 2025
    • Which precious metal to buy
  • Silver
    • Silver prediction 2025 – 2030
    • Will silver exceed $30?
    • When will silver hit $50?
    • Can silver hit $100?
    • Silver shortage
    • 50-year silver chart
    • Silver bullish reversal
    • Silver seasonality charts
    • How to invest in silver
  • Gold
    • Gold prediction 2025 – 2030
    • Will gold set new ATH?
    • Will gold hit $3,000?
    • Can gold hit $10,000?
    • Gold chart 10 years
    • Gold chart 50 years
    • Gold chart 100 years
    • Gold silver ratio
    • Gold seasonality charts
  • Commodities
    • Coffee forecasts
    • Sugar forecasts
    • Nickel forecasts
    • Lithium investing
  • Crypto forecasts
    • BTC prediction 2025 – 2030
    • ETH prediction 2025 – 2030
    • SOL prediction 2025 – 2030
    • XRP prediction 2025 – 2030
    • XLM prediction 2025 – 2030
    • BNB prediction 2025 – 2030
    • ADA prediction 2025 – 2030
    • AVAX prediction 2025 – 2030
    • KAS prediction 2025 – 2030
    • NEAR prediction 2025 – 2030
    • BCH prediction 2025 – 2030
    • LINK prediction 2025 – 2030
    • DOT prediction 2025 – 2030
    • SUI prediction 2025 – 2030
    • ICP prediction 2025 – 2030
    • LTC prediction 2025 – 2026
    • STX prediction 2025 – 2030
    • DOGE prediction 2025 – 2030
    • SHIB prediction 2025 – 2030
    • PEPE prediction 2025 – 2030
    • FLOKI prediction 2025 – 2030
    • WIF prediction 2025 – 2030
    • ONDO prediction 2025 – 2030
  • News
    • Crypto news
    • Commodities
  • Login
Investing Haven
No Result
View All Result

Home » Crypto & Blockchain » Shiba Inu (SHIB) Price Analysis: This Powerful Pattern Suggests A Strong Breakout Is Underway

Shiba Inu (SHIB) Price Analysis: This Powerful Pattern Suggests A Strong Breakout Is Underway

Taki Tsaklanos by Taki Tsaklanos
September 24, 2024
in Crypto & Blockchain
shiba inu coin SHIB price points
2k
VIEWS
Share on FacebookShare on Twitter

After a period of consolidation, Shiba Inu (SHIB) price has created a powerful chart pattern, signaling a potential bullish momentum that has analysts predicting a breakout toward the psychological $.000020 may be imminent. 

This article probes the possibility of a Shiba Inu breakout towards $0.000020 based on the current market conditions, technical indicators, historical performance, and our recent SHIB price predictions.

SHIB burn plan and Shibarium launch finally paying off

Recently, Shiba Inu has experienced a surge in its burn rate, with over 410. 48 trillion SHIB tokens burned so far according to data from Shiba Burn Tracker. The burn initiative aims to enhance scarcity, potentially increasing the token’s value in the long run and it seems to be paying off already. 

Additionally, the Shibarium network, Shiba Inu’s Layer 2 solution launched on August 16, 2023, has shown remarkable growth, with daily transactions increasing by 70% and wallet addresses surpassing 1.82 million. This shows a growing investor confidence in Shiba Inu’s ecosystem.

shibarium transactions SHIB Shiba Inu Coin

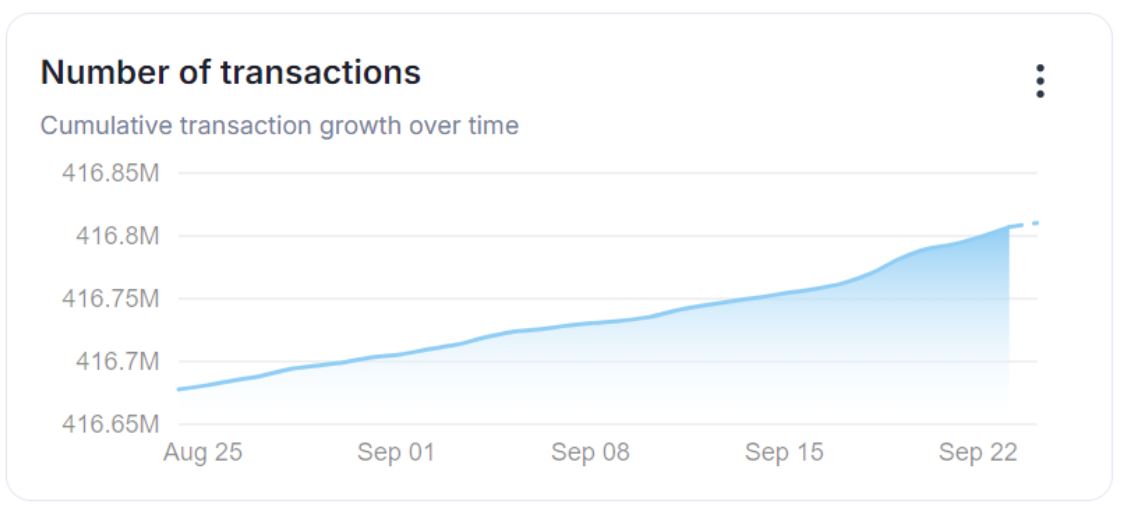
Source: Shibarium – scan data on Shibarium’s daily transcations over the past 30 days. 

As the Shiba Inu burn program continues to gather momentum and Shibarium Network continues to grow, SHIB’s price has flashed recovery signals following the prolonged price decline that occurred between March 6, 2024, and August 6, 2024, followed by a period of price consolidation.

Currently trading at approximately $0.00001444, Shiba Inu has experienced an 8.94% increase over the past week, with the overall price trend indicating significant bullish momentum.

Despite Shiba Inu remaining 79.77% lower than its all-time high of $0.0000725 recorded nearly three years ago in October 2021, the price of SHIB has closed above its daily opening price in 49.02% of the days in the past week, reflecting a modest bullish sentiment for the meme coin.

Optimistic builds as a symmetrical triangle pattern forms

The 4-hour and 1-week charts reveal that Shiba Inu is currently consolidating within a symmetrical triangle, characterized by converging resistance and support trendlines as highlighted by the renowned technical analyst Charting Guy (source: X).

$SHIB 📈

THE MEMES ARE READY 🐶 https://t.co/I6duve8dl7 pic.twitter.com/vrL9zHqBTZ

— Charting Guy (@ChartingGuy) September 23, 2024

The down-sloping trendline, which has been forming since May, indicates a gradual price decline, while the up-sloping trendline has emerged following a price dip from its yearly high of $0.000045 in March.

This symmetrical triangle suggests that SHIB is in a critical consolidation phase, which often precedes a price breakout.

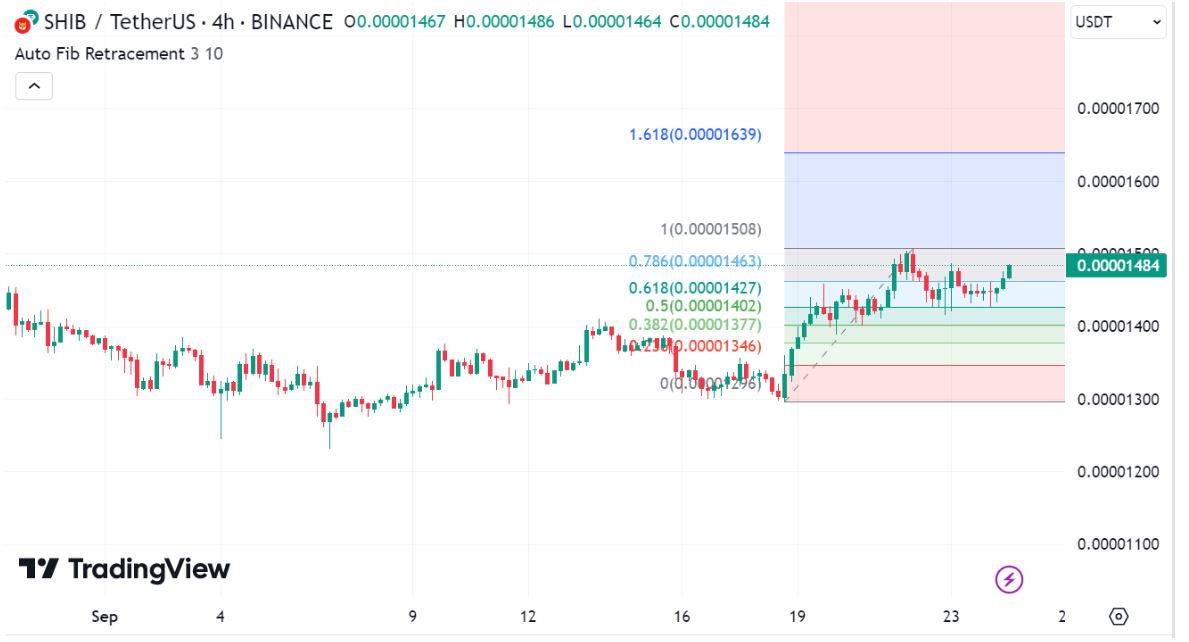
The breakout potential is further supported by SHIB bouncing back upwards after hitting the 50% Fibonacci level at $0.00001402 on the 4-hour chart.

Shiba Inu Coin SHIB price chart with Fibonacci levels
Shiba Inu Coin (SHIB) price chart with Fibonacci levels

Notably, the recent double-bottom reversal pattern from $0.0000130 has propelled the price upward, suggesting a major bullish reversal after the March to August drop may be underway. 

Analysts, investors, and traders are closely monitoring this formation, as a breakout from the symmetrical triangle could lead to a substantial upside move.

What RSI and moving averages say about the potential Shiba Inu breakout?

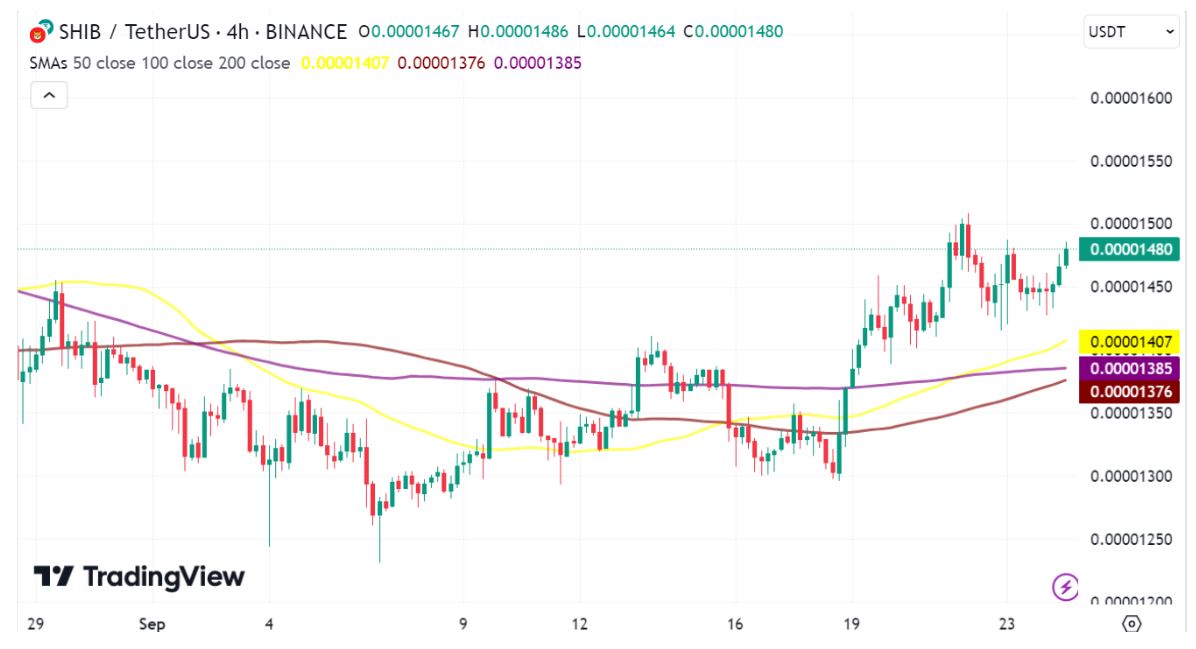
Technical analysis shows that Shiba Inu has surpassed the 50, 100, and 200-day exponential moving averages (EMAs), creating a bullish crossover that indicates strong upward momentum.

Shiba Inu Coin SHIB price chart with technical indicators
Shiba Inu Coin (SHIB) price chart with momentum indicators

The Relative Strength Index (RSI) currently sits at 61.15, reflecting natural market conditions without being overbought or oversold although it could cross into the overbought region soon going by the current trend.  However, the weekly RSI sits at 45.15, suggesting that there might be room for upward movement before reaching overbought levels in the long term.

Shiba Inu Coin SHIB price chart with technical indicators
Shiba Inu Coin (SHIB) price chart with RSI relative strength indicator

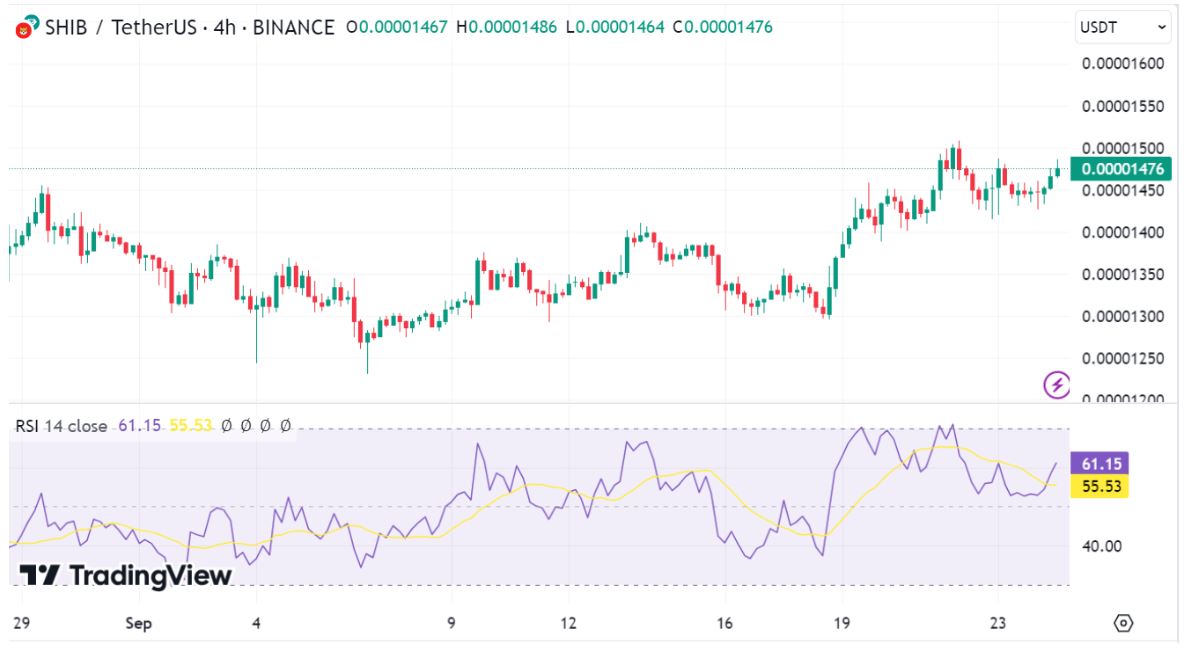
The bullish cycle on the four-hour chart is supported by the growing RSI divergence, indicating potential bullish momentum within the symmetrical triangle pattern. As the price consolidates, the negative cycle has failed to break the 50-day EMA, signaling strength in the bullish trend.

If Shiba Inu can maintain its upward momentum and break through the initial resistance levels, traders may start setting their sights on higher price targets.

Key SHIB price levels to watch as breakout beckons

In terms of Fibonacci retracement levels, the price target for Shiba Inu post-breakout is set at $0.00001508. If SHIB can close above this threshold, it is likely to move toward the next resistance level at $0.0000160.

An optimistic scenario could see SHIB reaching the 1.618 Fibonacci extension level at the $0.00001639 psychological mark. Beyond this level, Shiba Inu could skyrocket towards the 3.168 1.618 Fibonacci extension level at $0.00002063, with the ultimate goal being the previous all-time high of $0.00008841.

However, it’s essential to approach these predictions with caution, as the cryptocurrency market is known for its volatility. 

Significant selling pressure is anticipated between $0.000024 and $0.000030, where many investors have placed sell orders. This could act as a barrier to a sustained breakout if buying momentum does not outweigh selling pressure.

However, given the increasing community efforts to burn tokens and reduce supply, alongside the growth of the Shibarium network, Shiba Inu (SHIB) may be well-positioned for a rebound if market conditions align favorably.

10-YEAR ANNIVERSARY OFFER: InvestingHaven.com celebrates 10 years. Temporarily, you can enjoy a discount on our premium gold/silver and crypto reports. Or you can become a VIP member. Go to our anniversary deals >>
Receive our FREE crypto predictions alerts

Download 50 crypto investing tips

 premium service crypto teaser premium service SP-500

Related posts:

  1. 15 Cryptocurrency Forecasts For 2025
Tags: SHIB
Taki Tsaklanos

Taki Tsaklanos

Taki has +15 years of experience in global markets. He is passionate about forecasting markets - he calls it THE ART OF FORECASTING. His analysis methodology is unique and effective, yet easy to understand; it is based on chart analysis combined with intermarket / fundamental / sentiment analysis. His work appeared on major financial outlets like FinancialSense, MarketWatch,Twitter: twitter.com/investinghaven

Connect with InvestingHaven

Receive top notch forecasts for free.

*We hate spam as you do.

Site Navigation

  • RSS Feed
  • About us
  • Advertising
  • Sponsored Content Policy
  • Mission 2026
  • Sitemap
  • Privacy & Disclaimer
  • Terms of Service
  • Contact Us
investing haven logo

Precious metals market analysis including gold and silver price predictions. Crypto market analysis including highly accurate BTC ETH SOL XRP forecasts.

Copyright © 2025 InvestingHaven

Login to your account below

Forgotten Password?

Fill the forms bellow to register

All fields are required. Log In

Retrieve your password

Please enter your username or email address to reset your password.

Log In

Receive our FREE crypto predictions alerts

Download 50 crypto investing tips
No Result
View All Result
  • News
  • 2025 Forecasts
    • 10 market predictions
    • Dow Jones forecast 2025
    • S&P 500 forecast 2025
    • Nasdaq prediction 2025
    • Best crypto to buy now
    • Which crypto will explode
    • Best altcoins to buy
    • 15 crypto forecasts 2025
    • Which precious metal to buy
  • Silver articles
    • Silver prediction 2025 – 2030
    • Will silver exceed $30?
    • When will silver hit $50?
    • Can silver hit $100?
    • Silver shortage
    • 50-year silver chart
    • Silver bullish reversal
    • Silver seasonality charts
    • How to invest in silver
  • Gold
    • Gold prediction 2025 – 2030
    • Will gold set new ATH?
    • Will gold hit $3,000?
    • Can gold hit $10,000?
    • Gold chart 10 years
    • Gold chart 50 years
    • Gold chart 100 years
    • Gold silver ratio
    • Gold seasonality charts
  • Commodities
    • Sugar forecasts
    • Coffee forecasts
    • Nickel forecasts
    • Lithium investing
  • Crypto news
  • Crypto forecasts
    • BTC prediction 2025 – 2030
    • ETH prediction 2025 – 2030
    • SOL prediction 2025 – 2030
    • XRP prediction 2025 – 2030
    • XLM prediction 2025 – 2030
    • BNB prediction 2025 – 2030
    • ADA prediction 2025 – 2030
    • AVAX prediction 2025 – 2030
    • KAS prediction 2025 – 2030
    • NEAR prediction 2025 – 2030
    • BCH prediction 2025 – 2030
    • LINK prediction 2025 – 2030
    • DOT prediction 2025 – 2030
    • SUI prediction 2025 – 2030
    • ICP prediction 2025 – 2030
    • LTC prediction 2025 – 2026
    • STX prediction 2025 – 2030
    • DOGE prediction 2025 – 2030
    • SHIB prediction 2025 – 2030
    • PEPE prediction 2025 – 2030
    • FLOKI prediction 2025 – 2030
    • WIF prediction 2025 – 2030
    • ONDO prediction 2025 – 2030
  • Premium Crypto Alerts
  • Premium services

Copyright © 2025 InvestingHaven

×