Three drivers of the gold price price will likely push the gold price to new ATH: inflation expectations, the Yen, and speculators. Stated differently, the gold price breakout of 2024 has legs.
Inflation expectations are on the rise, and the Yen may be starting an uptrend. Both are positively correlated with gold. Speculators are expected to continue to add to their long positions before it becomes a consensus long trade.
Related – read our gold price forecast 2024
We look at the gold price charts and the 3 fundamental drivers for the gold price.
Gold price breakout of 2024 is here
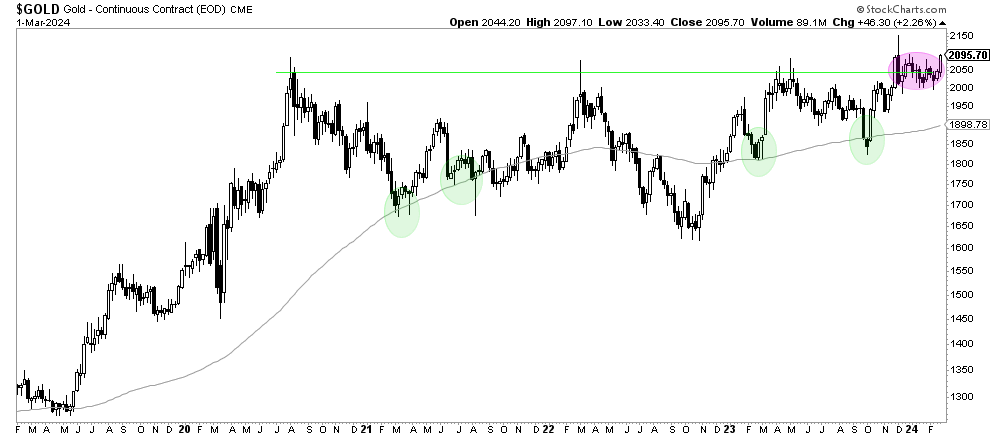
The gold price that has the clearest and cleanest set up is the weekly price chart.
What stands out from this chart:
- The highest gold price weekly closing price in history.
- A 3-month consolidation around former ATH (purple circle).
- A rising long term moving average.
The breakout is beautiful – above all, the gold price breakout of 2024 is solid after a very long consolidation.
Note that it is important to stay away from short term gold price information as that’s mostly noise. We focus on decent gold price analysis, not noise.
Secular gold price breakout on the monthly
When zooming out, the gold picture becomes even more interesting and solid.
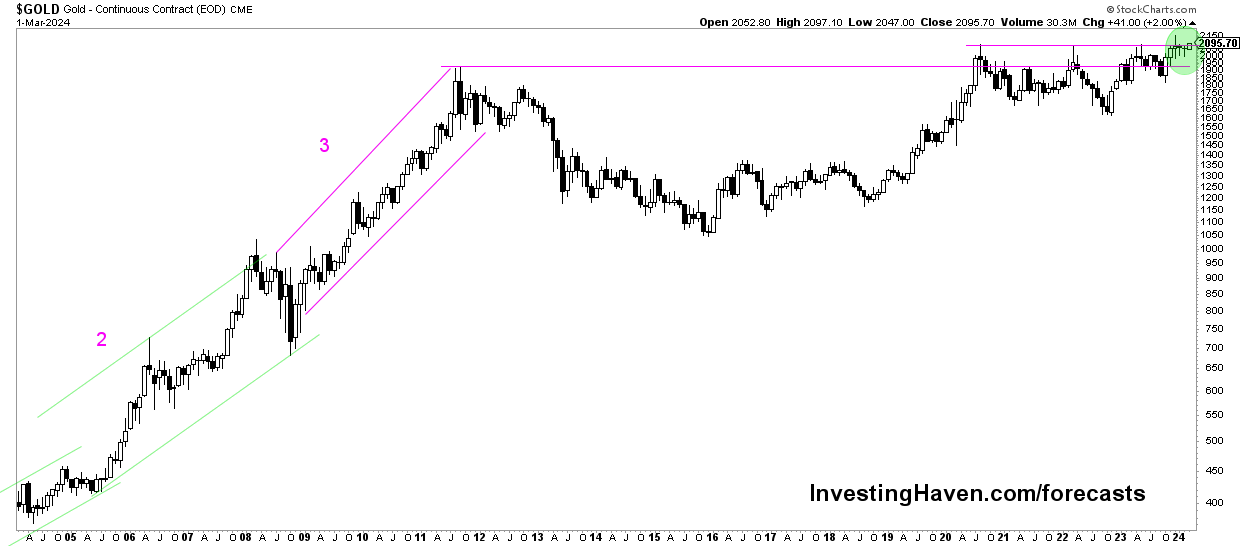
Below is the monthly gold price chart, exhibiting the secular nature of the gold breakout of 2024.
This is really solid – as a long term chart pattern, we observe a cup and handle formation. Moreover, the 3-year consolidation is put in perspective on this chart.
Visibly, this setup is solid, and it allows for gold to set continued new all-time highs in 2024.
Gold breakout – fundamental catalyst for all-time highs
Catalyst #1 for the gold price breakout to new all-time highs is inflation expectations.
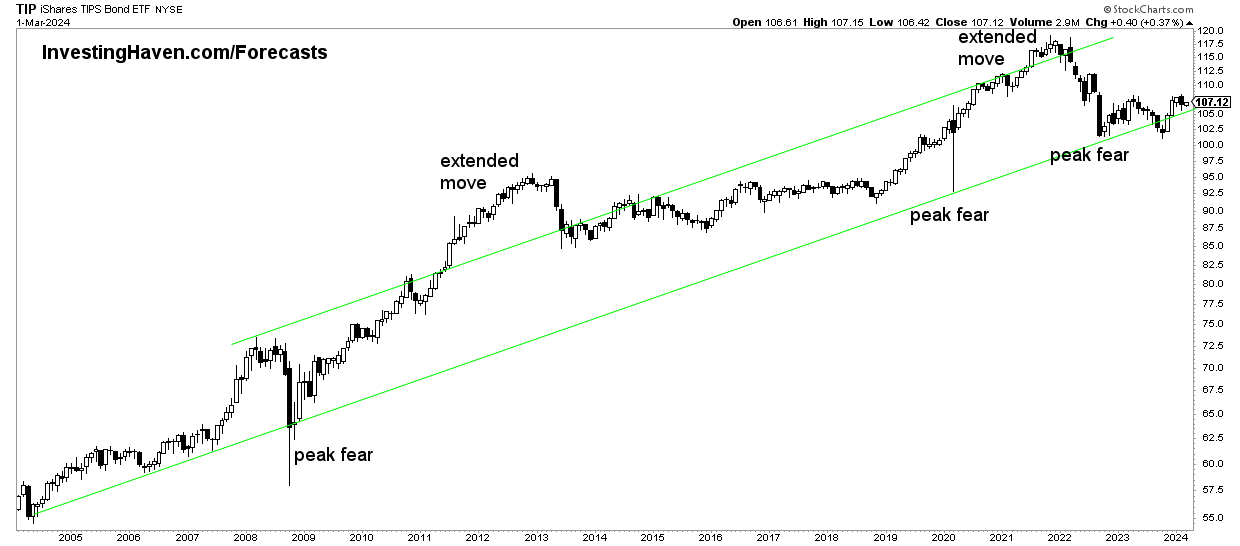
The first catalyst is the positive correlation between inflation expectations (as per TIP ETF) and the gold price.
We explained this correlation, at length, in our gold price forecast article.
As seen on below chart, the inflation expectations chart is moving in a long term rising channel. As long as this is the case, it will positively influence the gold price.
Gold correlation with the Yen index set for new ATH
Catalyst #2 for the gold price breakout to new all-time highs is the Yen.
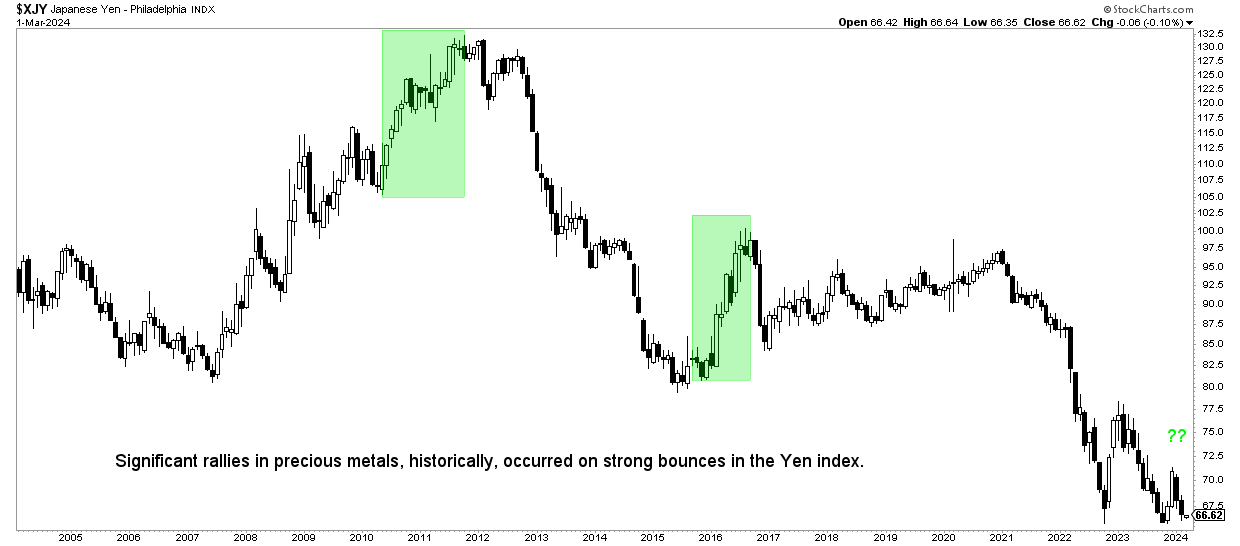
The second catalyst is the positive correlation between the Yen index and the gold price.
As seen, historically, precious metals did very well at times when the Yen rose sharply. This was especially true after the big decline in the Yen in 2012/2015. The big swing in the Yen, in 2016, happened concurrently with the big swing in precious metals prices in 2026. In different conditions, though with a similar outcome, was the big swing in the Yen in 2010/2011.
Gold price driver for higher highs (continued ATH)
Catalyst #3 for the gold price breakout to new all-time highs are speculators.
The third catalyst is the positive correlation between rising speculator positions and the gold price.
As seen below (chart courtesy: GoldChartsRUs.com), speculators are not unanimously net long gold in the futures market. The way to read this chart – once there is a consensus long (or not) by speculators, the price of gold tent to peak (bottom). In other words, speculators are the ultimate contrarian indicator, especially if they are all unanimously at the same side of the trade.
At this point in time, there is plenty of room to add many more gold long contracts by speculators before reaching a consensus long trade.
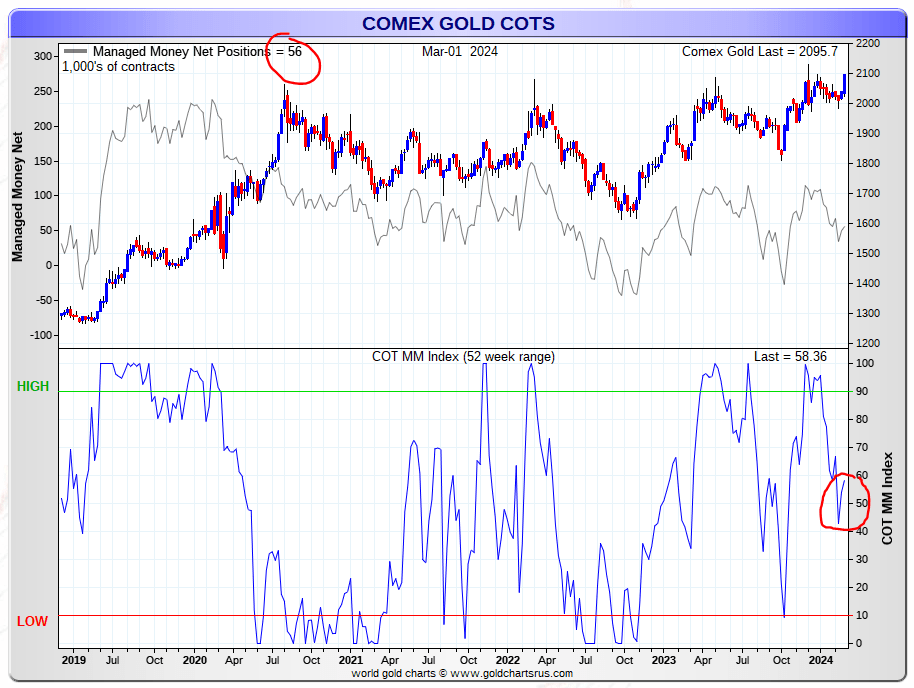
We are touching a very sensitive matter with this chart – the heart of the gold price manipulation thesis. The scope of this article is not about the dynamics of the gold manipulation though.
Gold price breakout 2024 and continued ATH
The gold price charts and the gold price catalysts are in agreement – the gold price breakout of 2024 has legs.
We expect higher highs in the gold price in the coming months.
In our premium service, we will be looking for signals of a turning point. For now, the right side is long.
The leveraged play on gold is silver – we are confident that our silver forecast of $34.70 is underway now.


