Our annual crude oil price forecast for 2020 is neutral with one exceptional bullish spike. This is likely to happen at the end of 2020 or in 2021 when the Euro goes up. That’s why readers should follow our 2021 forecasts thoroughly. Even though we do not expect a big move in crude oil as per our 2020 forecast we still are on the lookout for a low probability bullish spike. Note that all our forecasts are analyzed and written by InvestingHaven’s research team, not by other analysts, in a simple to understand forecasting framework.
Per our 1/99 Investing Principles it is only 1% of the time that crude oil registers a bullish turnaround. For investors all that matters is when crude turns bullish. That’s because crude has a track record of rising aggressively, but it only does so if and when it breaks out.
Why This Crude Oil Price Prediction?
We explained in great detail that our mission here at InvestingHaven is to catch those big moves in markets. Mostly there are 2 to 3 amazingly profitable opportunities per year in markets. Those are the ones we want to forecast and be invested in.
Read more about this in our piece: Forecasting The 3 Top Opportunities Per Year Becomes InvestingHaven’s Mission.
As per legendary investor Stan Druckenmiller:
The mistake 98% of money managers and individuals make is they feel like they have got to be playing with a bunch of of stuff. And if you really see it, put all your eggs in one basket and watch the basket very carefully.
Many investors tend to stick to facts from the past. Commodities investors continue to refer to the big commodities boom of 2002 – 2011.
Especially crude oil saw an amazing spike in 2008 right before the global financial crisis. But sticking to that one fact implies you will miss a lot of opportunities just because you did choose to wait for that one asset to move.
We turn things around. Based on our forecasts, including this crude oil price forecast for 2020 and 2021 we try to understand which markets may become hot in the next 24 months. Crude oil is not one of them according to our analysis though it will become bullish at a certain point.
Read on to understand what to look for before getting exposure to the crude oil market.
Note that we expect some other markets to do much better in 2020 and 2021 that the crude oil market. Anyone interested to invest in crude oil can check this guide. However, we urge readers to check our other forecasts to find better opportunities.
Our Crude Oil Price Forecast for 2020 and 2021
Let’s start with our conclusion. Readers who don’t want to understand our underlying forecasting method can ignore the rest of the article.
We expect crude to be neutral overall, but fall with the Euro and rise with the Euro. There will be one bullish spike in 2020 or 2021, and the Euro will reveal when this will happen. This is the basis of our crude oil price forecast for 2020 and 2021!
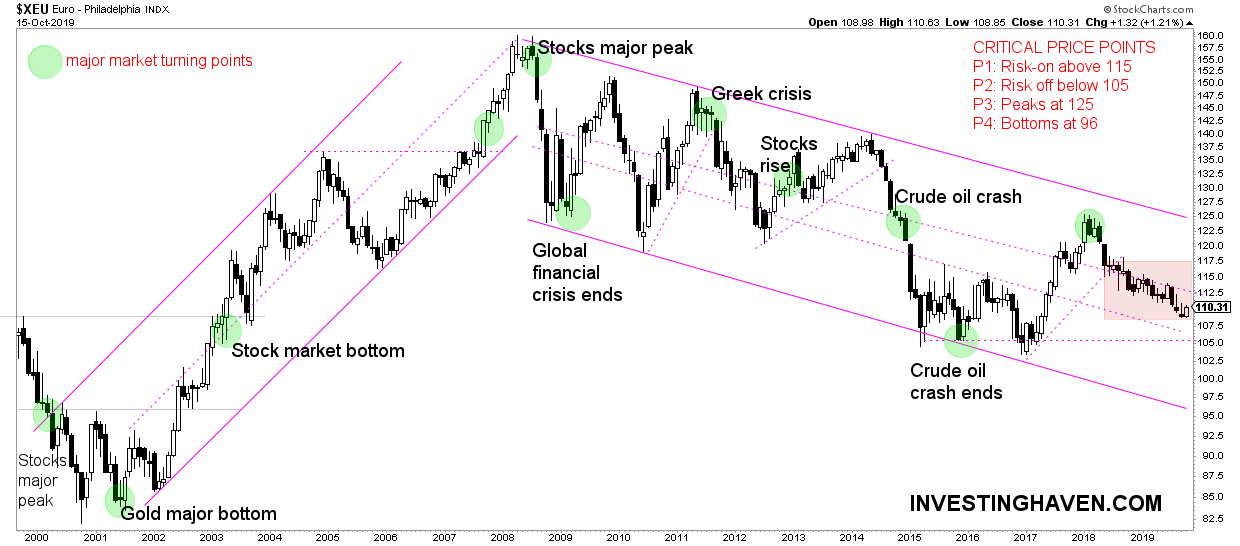
The Euro may start rising at 3 price levels.
Either at current levels in which case we expect a short term rise in crude.
Either after the Euro has fallen to 105 points. This is the most likely scenario. Crude will be a strong buy, and we expect a strong move higher (not a multi-bagger move but certainly 30 to 50 pct).
Either the Euro goes to the bottom of its channel in the 96 to 98 area where all commodities but especially crude oil will be a very strong buy. Not likely to happen though.
In other words we have to wait for the Euro first. Its chart pattern will reveal a breakout. Once that happens it will send bullish energy to crude oil.
Crude Oil Price Forecast Summary
Based on the leading indicators (or lack thereof) and more importantly the chart setup we see the following crude oil price forecast for 2020 and 2021.
This is our forecasted crude oil price for the coming years. Prices reflect crude's spot price.| Year | Crude oil price forecast | Conditions | Invalid |
|---|---|---|---|
| 2020 | Neutral to bearish, start of a bullish spike | Within its wide range, Euro neutral to bearish but starts bullish breakout | Euro wildly bearish |
| 2021 | Neutral with bullish spike, followed by heavy retracement | Euro breaks out, crude to the top of its range | Euro wildly bearish |
| 2022 | To be confirmed | To be confirmed | To be confirmed |
Leading Indicators for our Crude Oil Price Forecast
This is a big problem for our crude oil price forecast. There are hardly any leading indicators!
You heard this very well, hardly any leading indicator to forecast the future price of crude oil. So then how is it possible to do a reliable forecast?
We have to work with just 2 inputs.
First, the Euro is by far the most important, arguably the only, leading indicator for the crude oil price. This means we have to carefully analyze the Euro chart carefully, very carefully.
Second, the crude oil chart itself. We have to rely on the chart patterns that we find on crude’s long and medium term timeframes. Here as well, the trick is to make a thorough analysis of the chart(s) and the patterns.
This implies we have not a lot of data to work with. The data we have (Euro charts and crude charts) need to be analyzed thoroughly. In other words quality is much more important than quantity when it comes to forecast the future direction of crude oil.
Wait a minute, what about supply demand factors? In the end commodities have supply and demand, and price is determined by supply and demand. Think twice, we will make the point in the next section that this does not work when really big moves are taking place.
So no, supply demand is not a reliable factor in forecasting the crude oil price for 2020, 2021 nor any other year!
Who Forecasted The Grand Crude Oil Crash?
Let’s go back to the previous point about supply demand factors and the fact they are not useful for our crude oil price forecast.
We want to go back to the year 2014. It was the year the crude oil price crash! Crude fell some 75% in less than 18 months.
Any reasonable person would say that supply and demand was way out of synch, and this would have caused the price of crude to crash.
Nothing is further from the truth!
Official sources that report on supply and demand continuously publish their outlook, forecast and updates thereof.
Not anyone (!) was able to forecast this historic crash in crude.
The U.S. Energy Information Administration (EIA), publisher of the 2014 global energy report, did not refer to anything like a market imbalance!
Nor did the OPEC, a global reference in the oil market, in their June 2014 crude oil report.
There is sufficient evidence that higher economic growth in the current quarter will materialize, helping to compensate for the subdued performance of the global economy in 1Q14. This, along with expectations of higher growth in the second half of the year, is seen resulting in annual growth of 3.4%. Indeed, the expected rebound in the US economy and slight acceleration of growth in China – as indicated by manufacturing PMIs – provides a positive signal for a rebound in the global economy in the second half of the year, although with some uncertainties regarding the pace of growth.
On the contrary. Their forecast was that economic conditions were supportive of a higher crude oil price. This came in two months before the historic crash of -80% started!
Around the same time we saw this supply/demand report from the ?
The supply-demand balance for 2H14 shows that the demand for OPEC crude in the second half of the year stands at around 30.3 mb/d, slightly higher than in the first half of the year. This compares to OPEC production, according to secondary sources, of close to 30.0 mb/d in May. Global inventories are at sufficient levels, with OECD commercial stocks in days of forward cover at around 58 days in April. Moreover, inventories in the US – the only OECD country with positive demand growth – stand at high levels. Overall, the ongoing rise in supply would be adequate to satisfy the growth in oil demand in 2H14, resulting in a well-balanced market.
A well balanced market is what the OPEC wrote, and then a few months later one of the biggest crude oil crashes in history of mankind started.
We can continue for a while, with Accenture’s crude oil report or CNN data, … but the point is clear in the meantime. Nobody was able to forecast the crude oil price crash purely based on supply demand data.
In other words we conclude that supply demand is useless in forecasting the big moves in crude oil. And as investors we are ONLY interested in big moves, not the peanuts.
Leading Indicator: Intermarket dynamics, The Euro
As we figured out both fundamental economic data as well as supply demand data are useless as leading indicators for our crude oil price forecast for 2020, 2021 or any other year. The only reliable leading indicator is to be found in intermarket dynamics, the main theme of InvestingHaven’s research method.
As seen on below chart, our leading indicator for global markets, the EURO peaked at its major secular resistance right before the crude oil price crash started.
Note that this happened when crude oil’s long term trend was about to break down.
So the conclusion we derive from this chart, and mapping it to the crude chart, is that major moves happen in conjunction with major moves within Euro’s chart pattern. In general a rising Euro is bullish for crude’s price.
Right now the Euro is not bullish, it is trending down. However, it is near major support. We expect the 105 area to hold. In case the Euro falls below 105 we will see a test of the 98 to 96 area, not likely but we can’t exclude it.
So the most reasonable forecast we can do for the Euro is that it will stop falling in 2020. Once it starts rising, which might happen towards the end of 2020 or in 2021 we will see a rise in the crude oil price.

But why don’t we look for the Dollar chart instead of the Euro? In the end everyone knows that the Dollar is inversely correlated to crude oil.
The reason is the chart.
The Euro chart has a much more reliable setup in terms of chart pattern(s) to help forecast.
Crude Oil Charts and Price Targets
We turn our attention to the 2nd data point we use as an input for our crude oil forecast.
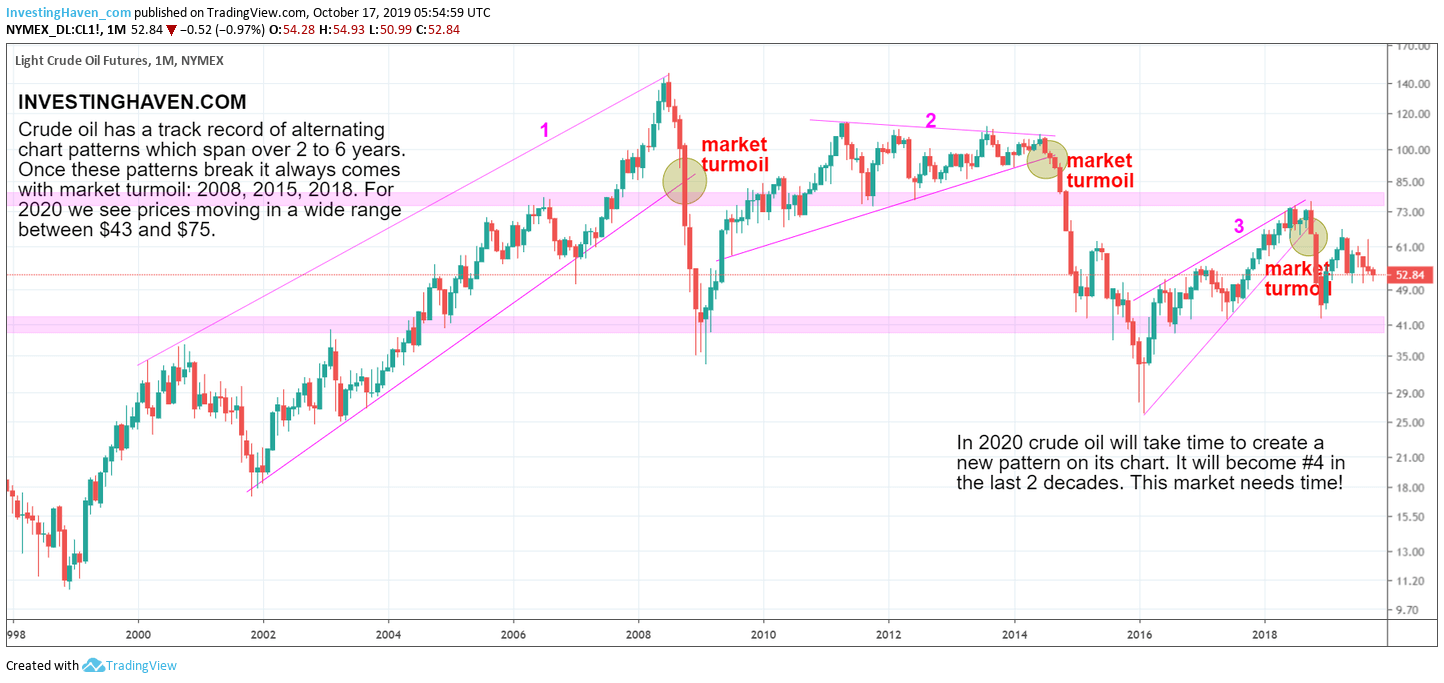
The chart patterns we see on this chart are pretty simple: 1 rising channel (last decade) and two triangle patterns (current decade).
However, crude has a complex chart, and we can’t accept simplification.
We must take the horizontal pattern into account as well. The horizontal bars are the ones that have an additional meaning.
After the breakdown of crude in 2018 we conclude that this market is in no-man’s land. And it will continue to be there for a while until a new pattern is visible. This may start in 2020, but will likely morph into something more ‘tangible’ in 2021.

We can reasonably expect crude to trade in a wide range between $43 and $75. Any move towards this support area can be considered a ‘buy the dip’ opportunity. Selling at higher level is a must!
Watch the Euro, and how it behaves in the 105 to 110 area, for a buy signal in crude.
However, the Euro falling below 105 would mean that both the Euro and crude would fall further, with support in the 96 to 98 area on the Euro. In that scenario crude would become a strong buy!
If anything the very long term crude chart shows a very wide range of $20 to $120 in the last 5 decades. So we can reasonably expect a certain point in the next decade to see a breakout above $120. We don’t expect this to happen in 2020 nor 2021 though.


