It is 2 years ago that we expressed an appetite to be invested in the Indian stock market. Not so since then, and we certainly are not bullish for the Indian stock market in 2020. In fact our India stock market forecast for 2020 is neutral, and we are uncertain about what might happen in 2021 or beyond. This is one of the few annual forecasts that is unclear to us especially because we see a divergence in the charts. The other neutral 2020 forecast on our list of 10 Market Forecasts For 2020 is sugar. Does our forecast exclude a bullish outcome? No, not at all. What we say is that are not in a position to do a reliable forecast for the Indian stock market in 2020 because of the divergence in the charts.
If anything forecasting is about identifying and analyzing leading indicators to determine a future direction.
When it comes to the Indian stock market we primarily have the generic emerging markets outlook as a leading indicator. We said that emerging stock markets should be mildly bullish in 2020.
Does it mean this is the only leading indicator? No.
Does it mean there Indian stock market will follow exactly the same path as the broader emerging markets? No.
What we say is that we simply lack sufficient reliable data points to make a forecast, so everything we’ll say is nothing more than an educated guess.
India Stock Market Forecast For 2020 Is Neutral
If we look at the charts of the Indian stock market we see this set of 4 charts that confuse us.
In a top down approach we look at the monthly charts first, and then the weekly chart. We take the Nifty 50 Index but also verify our observation (doubt) with the Bombay 30 Index).
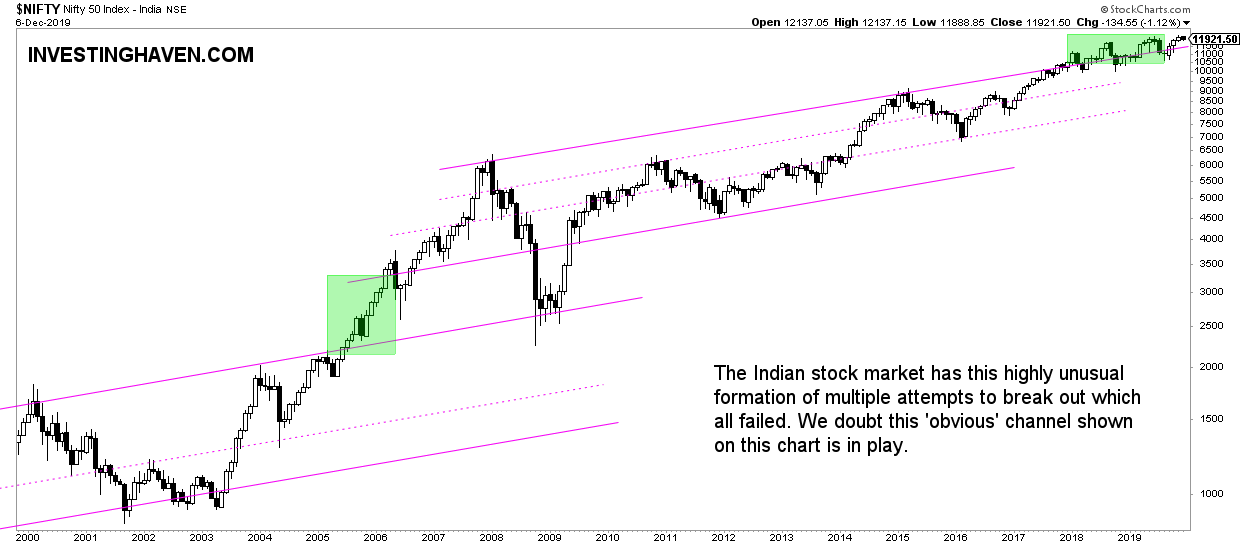
First the monthly chart of the Nifty 50 Index is very confusing.
Look at the green shaded area which is the pattern in the last 2 years.
Not only is this index going nowhere but more importantly it is constantly showing a failed breakout.
So then what’s going on? We need a different view to make something meaningful out of this.
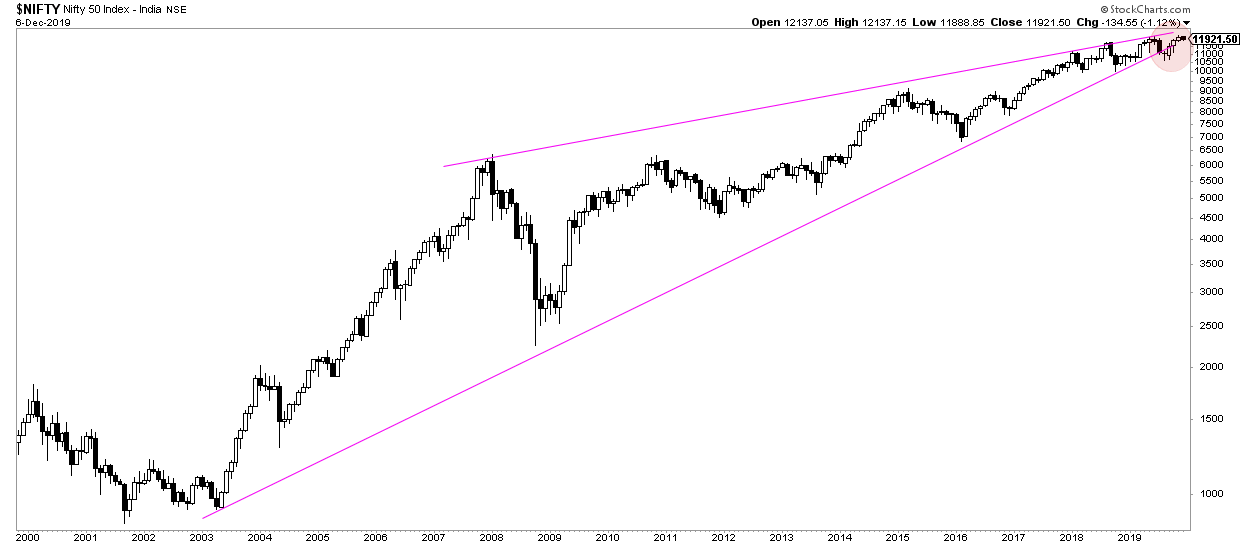
If we switch our view we see a totally different setup on exactly the same chart.
Below is this huge rising wedge which is a bearish setup by nature.
This pattern does make sense, and the Nifty 50 Index was pretty accurate in respecting this in the last 2 decades.
Note that the current situation shows a resolution is very, very close!
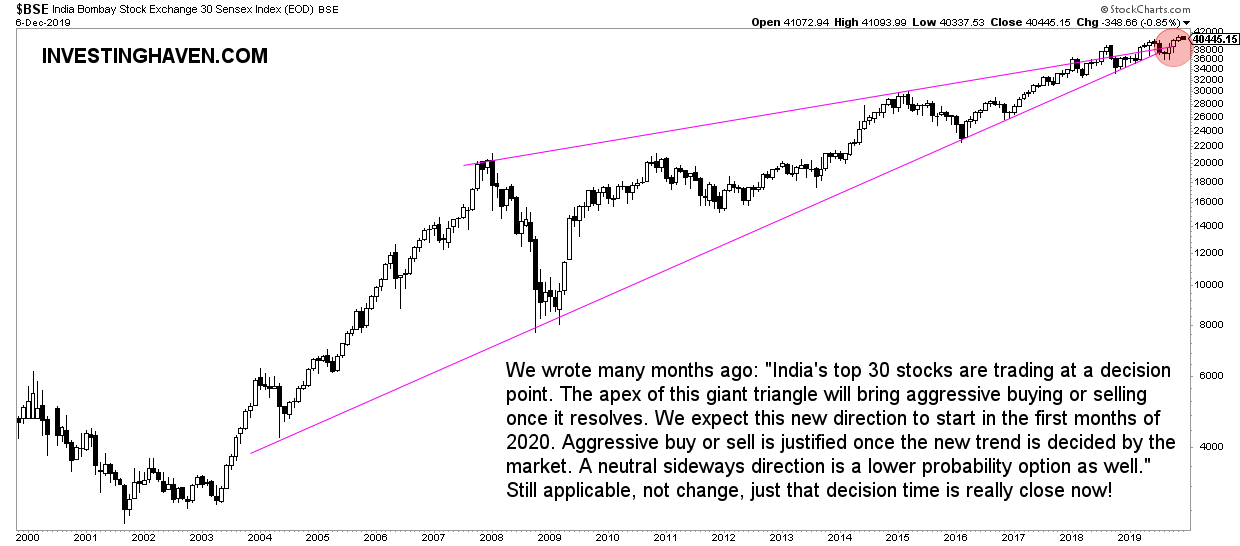
In checking the wedge setup with the Bombay 30 Index we see exactly the same setup.
One thing though the Bombay 30 shows a breakout. So any move higher from now is going to increase the probability of this rising wedge to be confirmed.
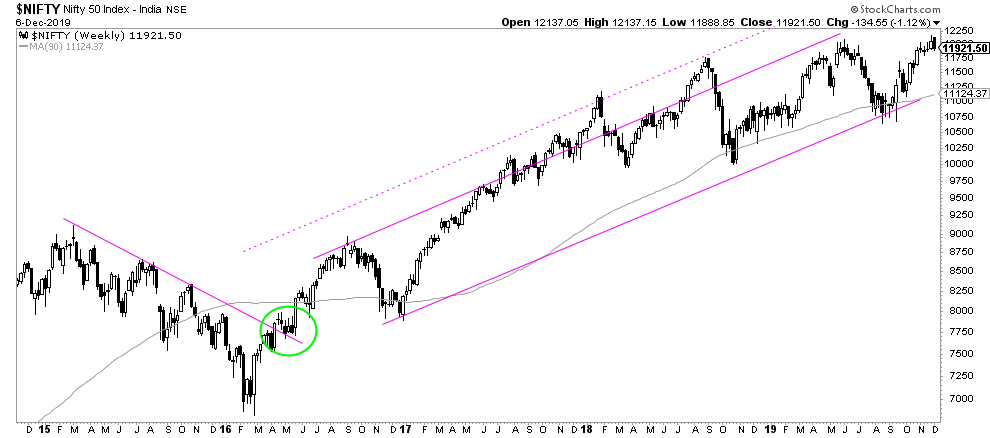
If we zoom in, and check the weekly chart of the Nifty 50 Index we see this rising channel in the last 3 years.
Again, this setup is diverging from the previous 2 charts, and does only partially help explain the first chart.
All in all we believe there is no meaningful answer to our Indian stock market forecast for 2020 because of all the reasons outlined above.

