Emerging markets are neutral for 15 years now. In fact, as 2024 kicks off, EEM ETF, representative of emerging markets, trades at the exact same point as the market’s top in 2007. Our emerging markets outlook for 2024 is neutral to mildly bullish, we expect a mild rise in EEM ETF in the first half of 2024. That’s because the USD, negatively correlated with emerging markets, is weak (for now).
Why do we focus on emerging markets given a bright outlook for U.S. stocks?
Well, in any diversified portfolio, it is worth looking into opportunities that are developing across the world and across asset classes. Our emerging markets outlook 2024 is meant to understand if emerging markets will offer potential opportunities for investors in 2024.
- Emerging markets leading indicators for 2024
- Emerging markets charts for 2024
- Emerging markets long term moving average
- Emerging markets outlook for 2024
- EEM ETF Top 3 Holdings
For readers that want the short version of this analysis, we can confidently say that the opportunities that emerging markets will offer in 2024 will be limited worst case, and fragmented best case. In other words, our high level emerging markets outlook 2024 suggests that, as a region, emerging markets are not poised to outperform the rest of the world.
Undoubtedly, individual markets or specific stocks in the wide region of emerging markets will be poised for growth, but analyzing them is beyond the scope of this article.
Emerging markets leading indicators for 2024
By far, the most concerning leading indicator for emerging markets in 2024 is the deflationary pressure that China is facing. This is important because EEM ETF, representing emerging markets, has a large weight of Chinese companies.
As Bloomberg reported recently, China’s Consumer Deflation Returns as Recovery Remains Fragile:
China’s deflation pressures worsened in October as consumer prices dipped back below zero and producer cost declines deepened, adding to expectations the economy needs more stimulus to shore up growth.
China is exporting deflation, which may be good for other countries that are importing China products. However, as the largest economy of the region, it’s not favorable for emerging markets as a region.
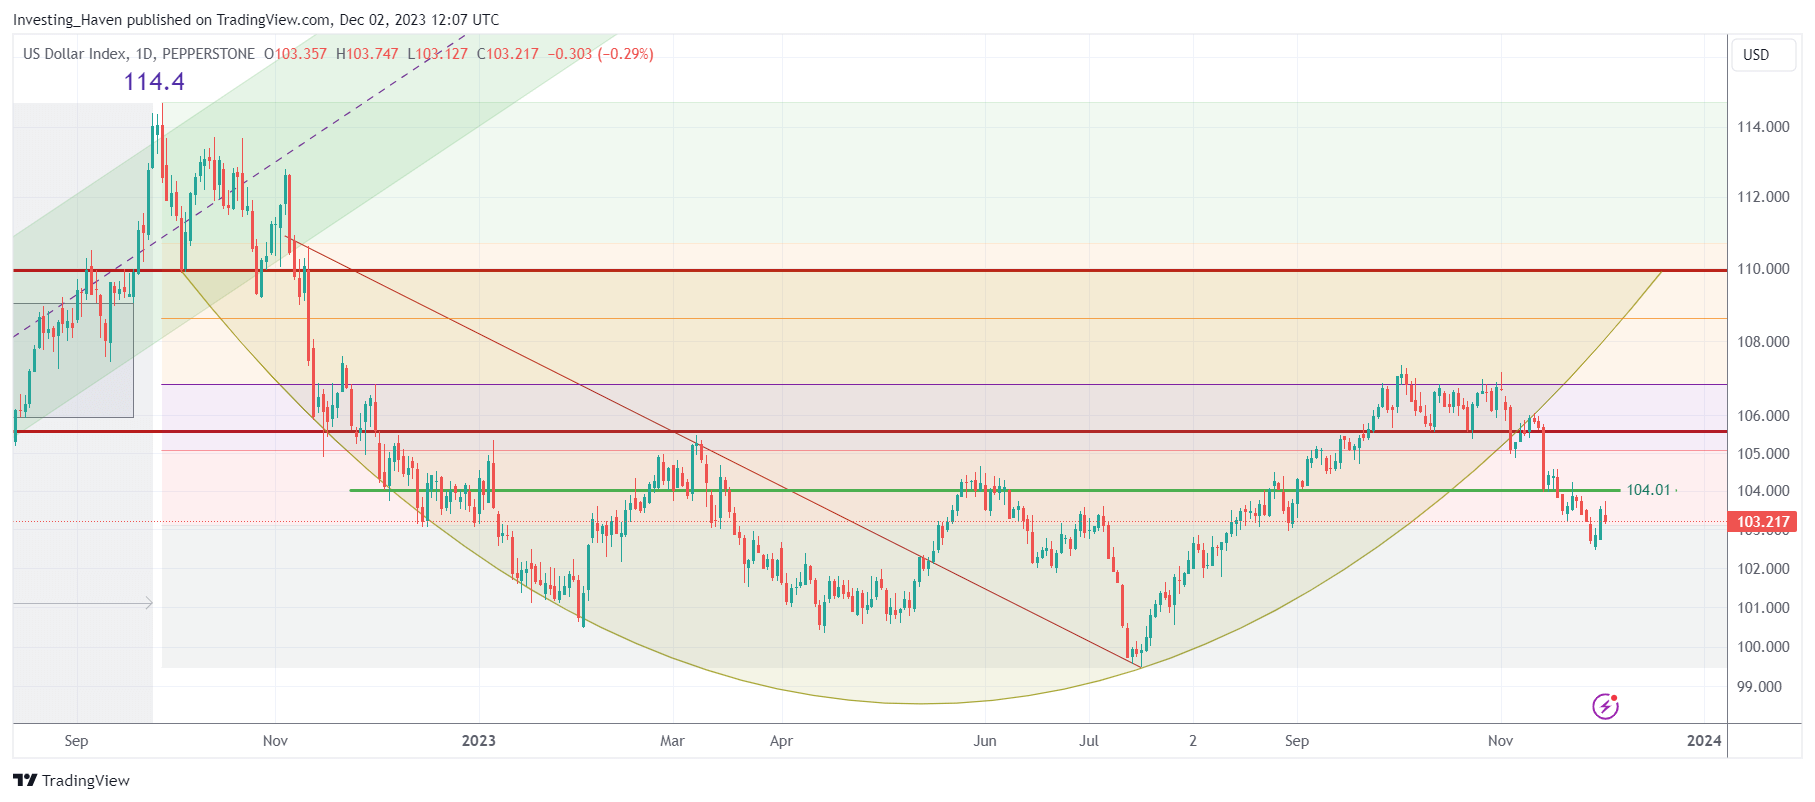
On the flipside, there is an historical negative correlation between the USD and emerging markets (EEM ETF), directionally: when the USD is weak, EEM ETF tends to perform well, the opposite is true as well.
If there is one factor that is somehow supportive for emerging markets in 2024 it is the expectation that the USD will not do very well in the first part of 2024.
Emerging markets charts for 2024
We start with a top down view on emerging markets.
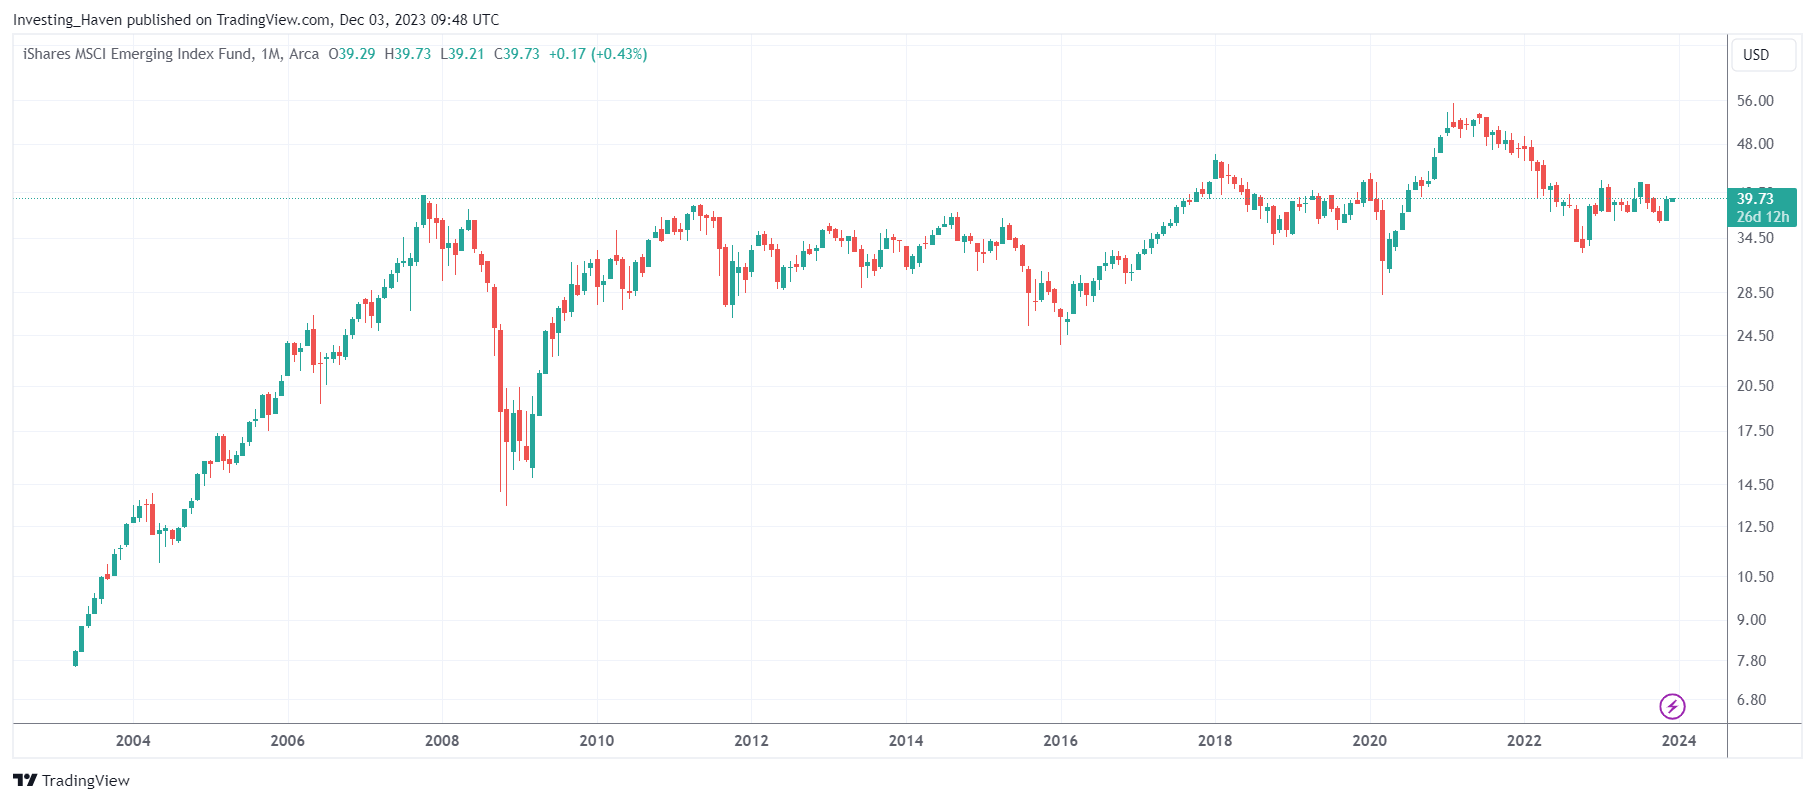
The monthly chart says it all – EEM ETF is consolidating around its 2007 top. Essentially, over the course of 15 years, EEM has been stable and flat. If there is a little bit of potentially good news, it’s that the 2007 top is now being turned into support. It is not outspoken, but there are signs that this is encouraging news for emerging markets in 2024.
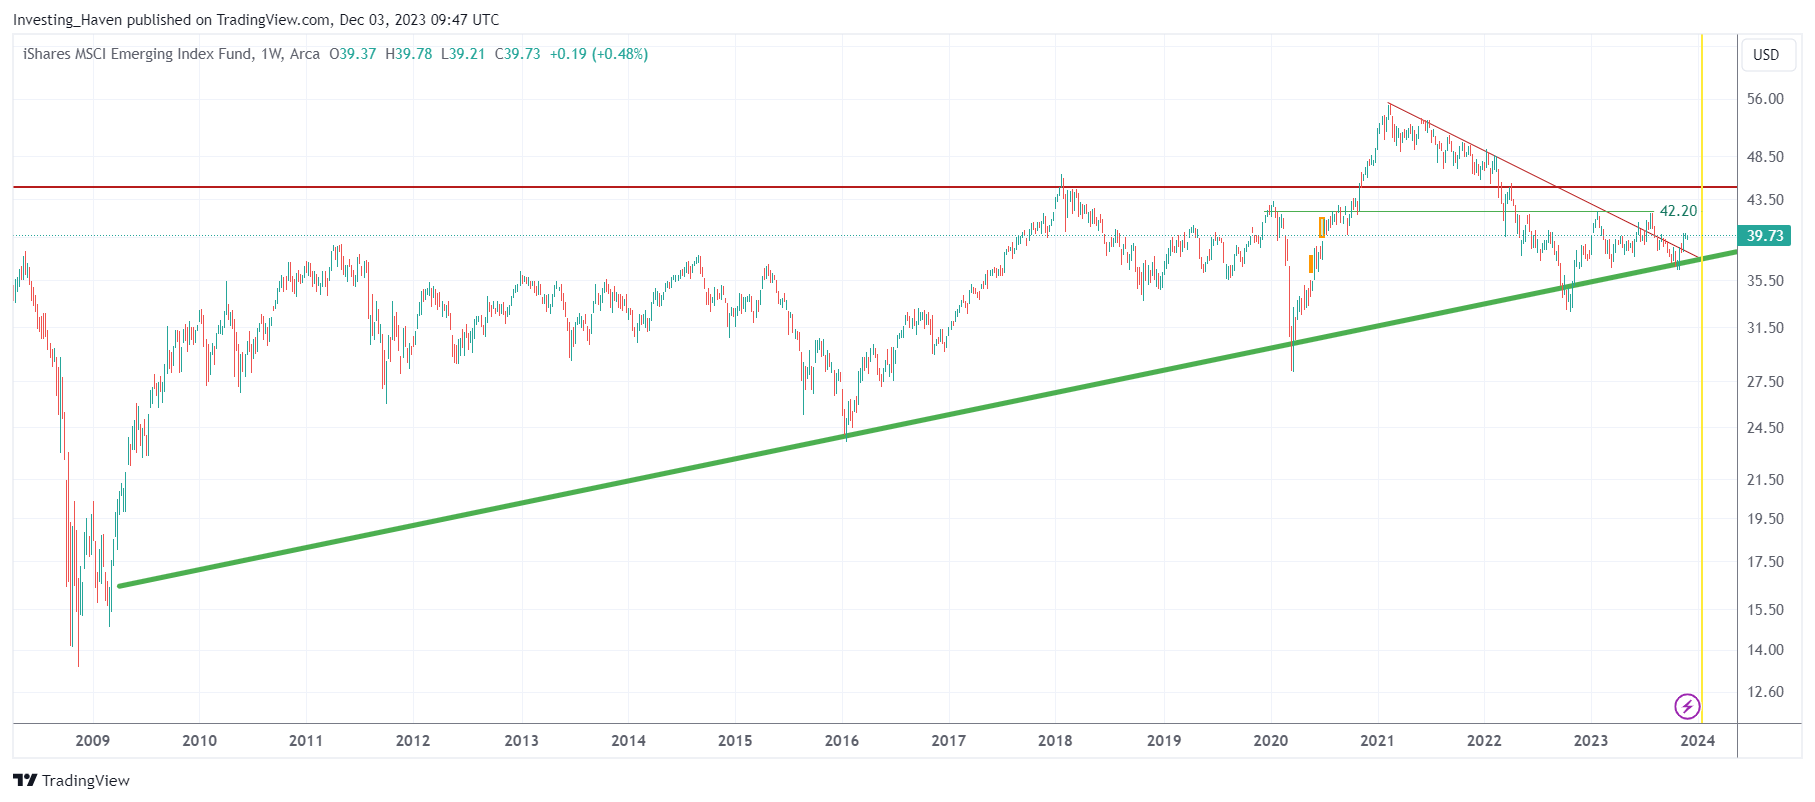
The weekly EEM chart gives some more detail. Even more encouraging news for the emerging markets outlook 2024 is that the 14-year rising trendline (green, thick line) is being respected on a 3-week closing basis. That’s good news, because combined with a relatively weak USD and the recent rise above the 3-year falling trendline it might create some bullish momentum for EEM in the first part of 2026.
Emerging markets long term moving average
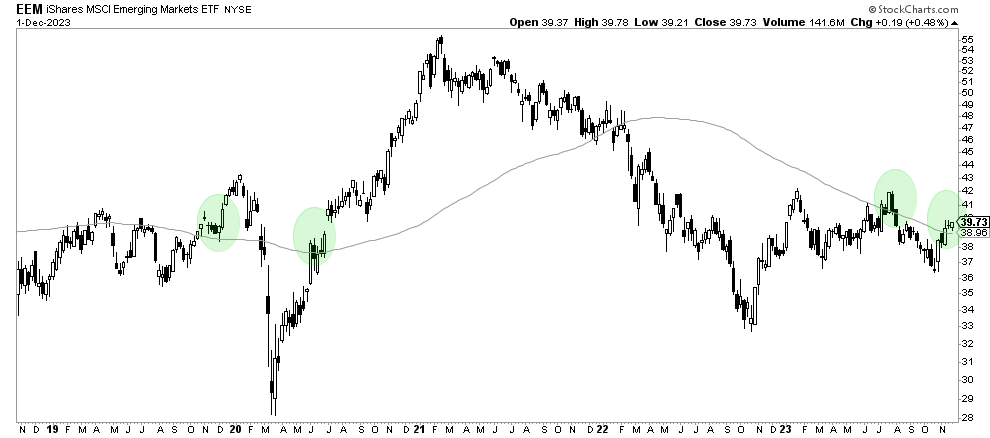
We are no fans of moving averages. There is one, and only one, moving average we track – the 90 week moving average (90 WMA). This moving average represents the long term trend, and has proven to be very reliable as the market tends to use this 90 WMA as a turning point (very often, reliably).
The 90 WMA of EEM is being broken to the upside right now. That’s encouraging, very encouraging for the emerging markets outlook 2024.
The last time this happened was back in the summer of 2023. As seen, with USD strength over the summer, it resulted in a rejection to move higher.
What’s different now is that the 90 WMA is starting to turn higher. It is a tiny detail, hardly visible, but a rising 90 WMA is the recipe for a potential trend change.
Emerging markets outlook for 2024
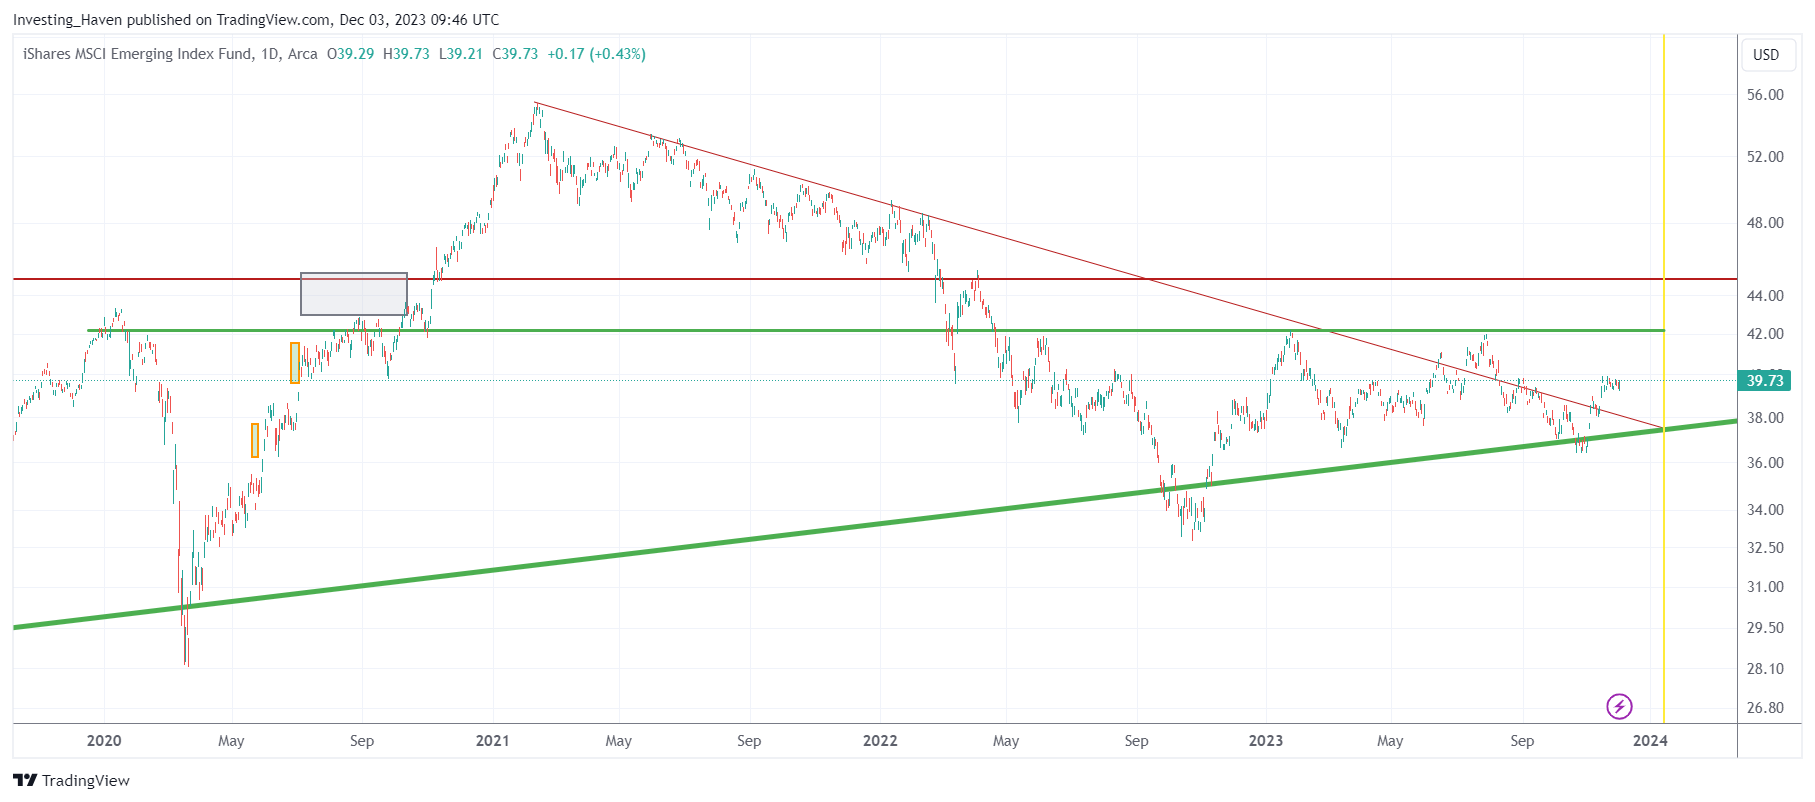
Moreover, on the daily EEM chart, exhibiting much more detail, we see a clear attempt to break the 3-year falling trendline, as 2024 kicks off.
The reversal right above the multi-year rising trendline (thick, green line) has a bullish profile.
If we combine all of the above information, with the daily EEM chart, we can confidently say that the probability of a mildly bullish start of 2024 is high. Therefore, we believe that our emerging markets outlook 2024 is mildly bullish, with an upside target of up to 15% in EEM ETF (best case).
Invalidation of our mildly bullish outlook? The long term rising trendline is broken to the downside.
Important to note: the yellow line represents a decision point, as per cycle and timeline analysis. We encourage readers to check leading indicators and the EEM ETF chart in the 2nd half of January 2024 for clues about the impact of the decision point.
EEM ETF Top 3 Holdings
EEM ETF is heavily influenced by 3 stocks: Alibaba, Tencent, Samsung.
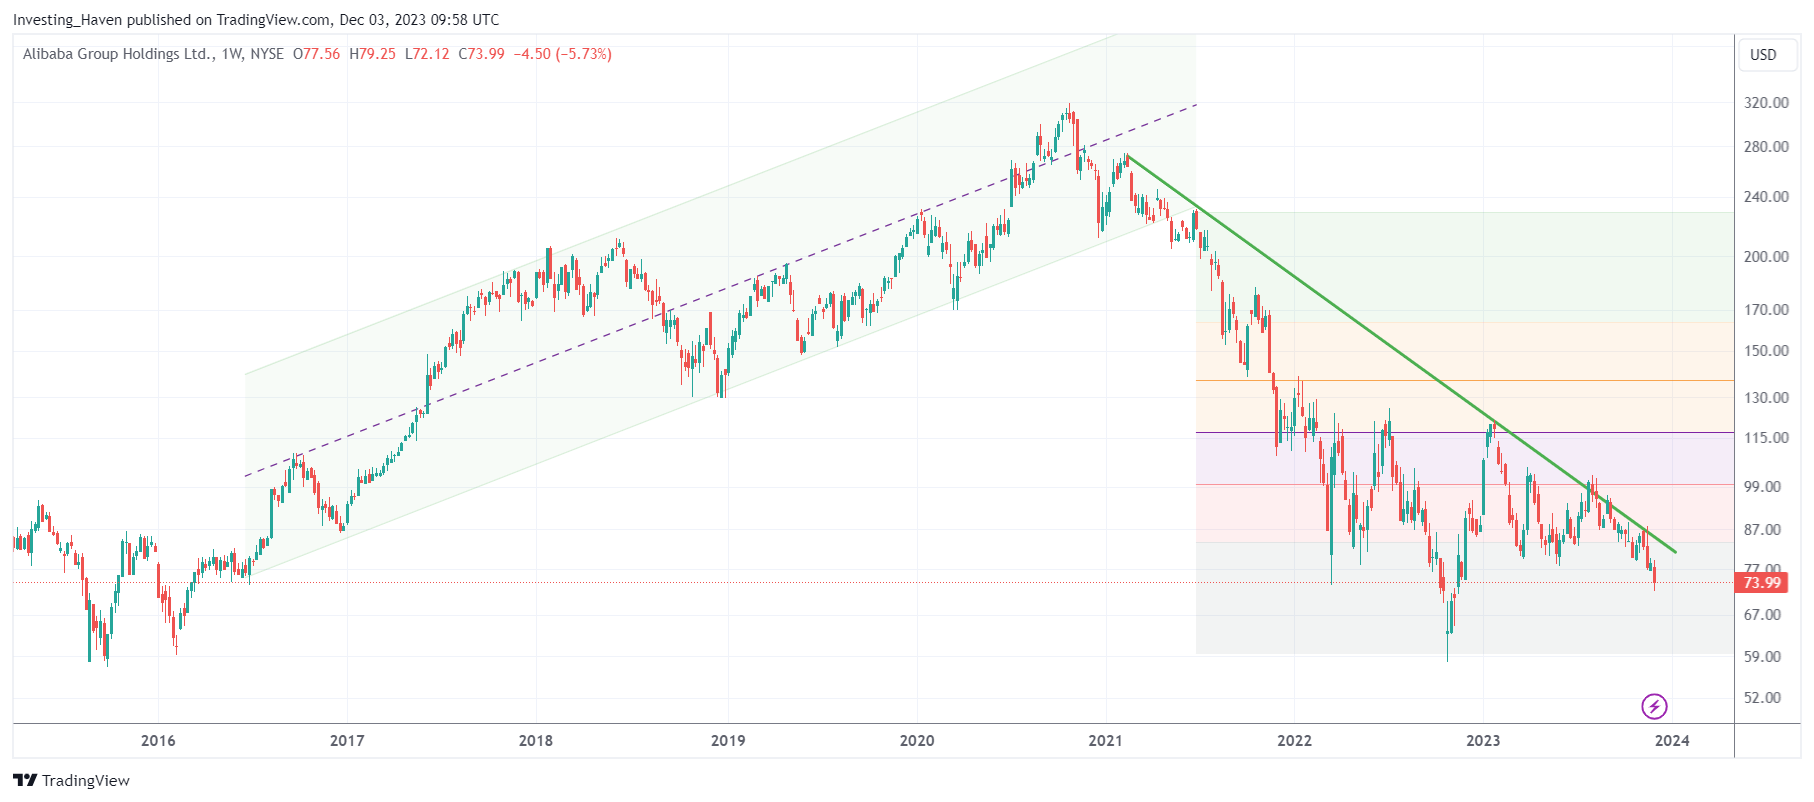
Alibaba’s monthly chart suggests that the stock is working on a long term bottom. While this setup is not bullish at this point in time, it has everything to turn into a bullish W-reversal. As soon as the 3-year falling trendline is cleared, to the upside, we expect a quick ‘pump’ in the price of this stock.
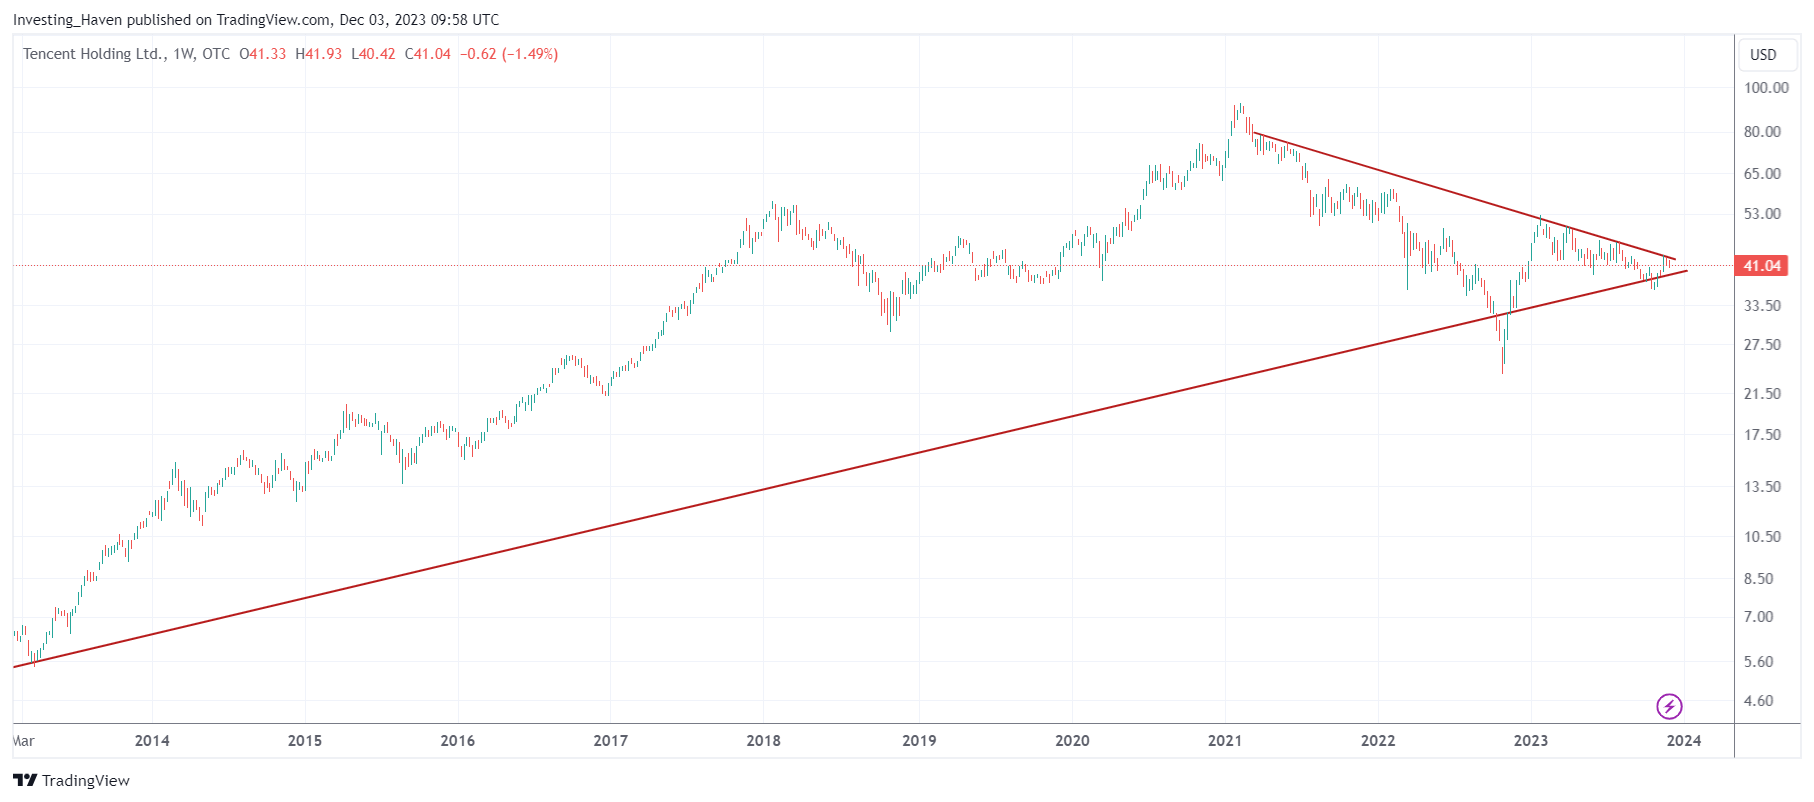
Tencent is respecting its multi-decade uptrend. It is now working on a breakout of what seems to be a bull flag or bullish reversal. This potential breakout might significantly influence the path of EEM ETF in 2024.
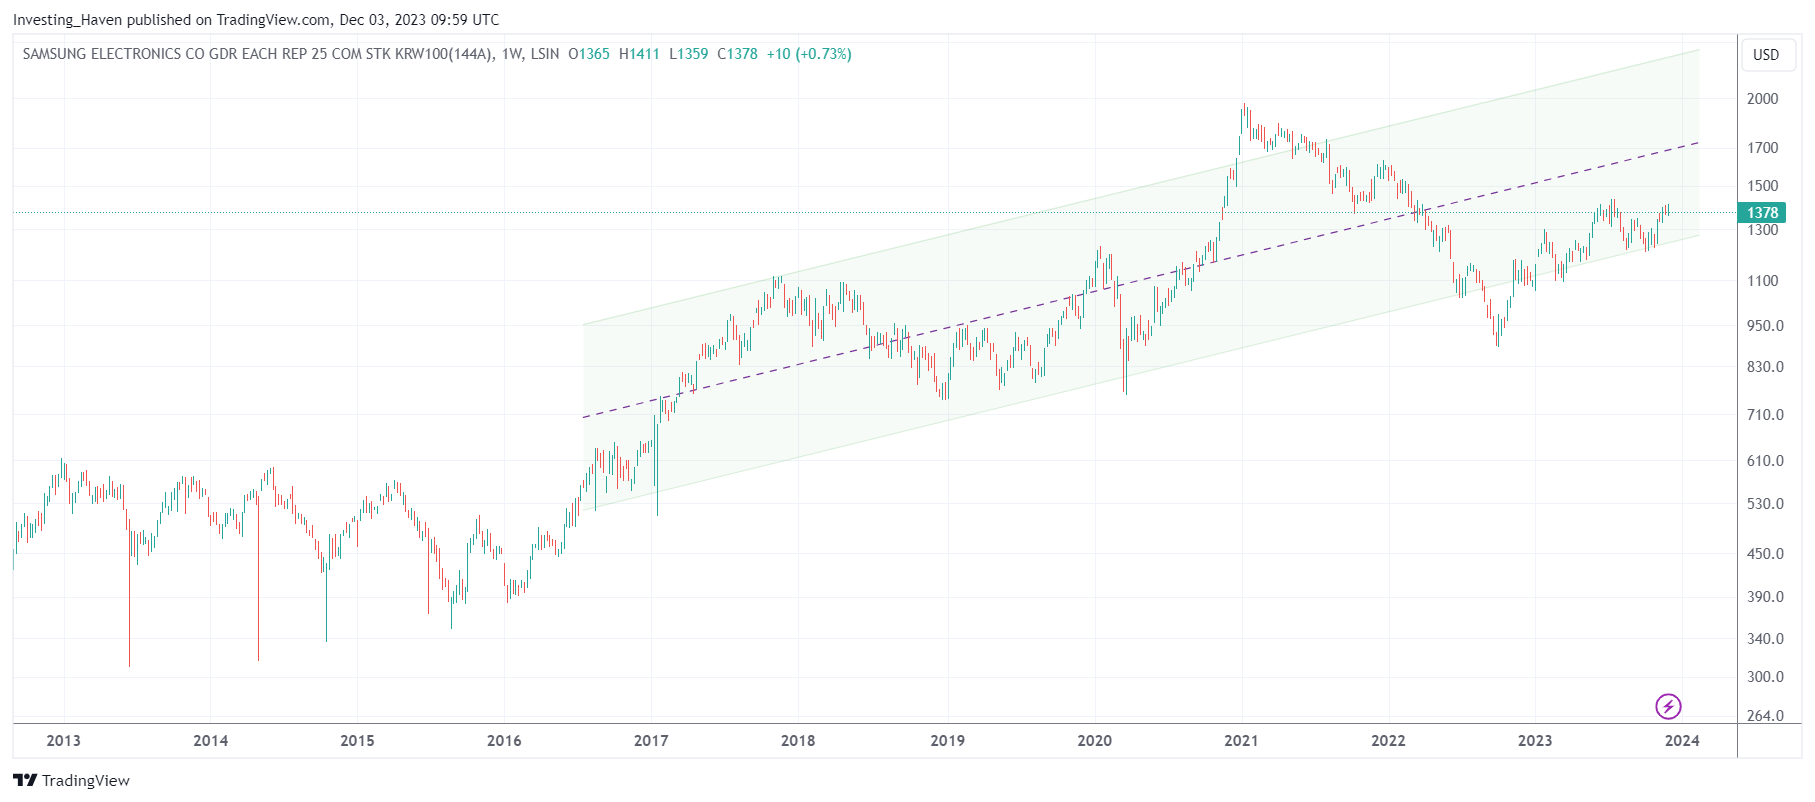
Samsung is in an uptrend, it’s very simple.


