
Our silver price prediction is overall bullish but a near term correction is possible. Silver will test ATH in 2026, However sharp gains increase the risk of a sharp correction when profit taking occurs.
InvestingHaven’s silver forecast is based on 2 decades of deep analysis, focused on understanding silver price influencers.
This silver price forecast is created based on a deep understanding and thorough analysis of silver price influencers.
The internet is full of pseudo silver price forecasts characterized by large tables which are generated by AI. Those impossible-to-read tables are so called ‘silver price forecasts‘. Our silver forecasting work is very, very different.
January 2026 – Charts and commentary in this article are updated. Our silver price forecasts remain the same.
Read on to understand our short term and long term Price prediction for Silver.
Silver price prediction research – outline
The topics we cover in our research predicting silver for the period 2025 through 2030:
- 1. Silver price prediction: summary
- 2. Leading indicators supporting a bullish silver prediction
- 3. Silver charts supporting a bullish forecast
- 4. Silver leading indicator #1: Gold
- 5. Silver leading indicator #2: Inflation expectations
- 6. Silver leading indicator #3: EURUSD
- 7. Silver leading indicator #4: Futures market
- 8. Silver leading indicator #5: Physical silver shortage
- 9. Silver price chart: the most powerful reversal in history?
- 10. A global silver bull market is already here
- 11. Silver price prediction: an overview
- 12. Silver forecasts from financial institutions
- 13. Silver Correction Prediction
- 14. Silver price predictions FAQ
Readers only interested in the take-aways can read our silver prediction summary (next section, below). Whoever is interested in our deep research is recommended to read the entire article.
1. Silver prediction 2025 2026 till 2030: summary
This is the outcome of our gold price prediction analysis outlined in the remainder of this article.
- 2025: silver price touches $125.
- 2026: silver consolidation around $50.
- 2027: silver moves closer to $77.
- 2030: silver price prediction $82.
The ranges indicated in this summary are estimates produced by research conducted by InvestingHaven.com. Inputs consist of intermarket trends, silver’s 5 leading indicators, and secular silver price charts.
Silver prediction research suggests the next few years will be mildly to wildly bullish. However, this bullish thesis invalidates once silver drops and stays below $19.50, a low probability outcome.
2. Bullish silver prediction – 5 leading indicators
According to our methodology, a bullish silver price prediction requires 5 leading indicators to be supportive:
- Gold has to be in a confirmed secular bull market -> gold confirmed its bull market in March 2024.
- Inflation expectations need to respect their long term uptrend -> confirmed.
- The EURUSD cannot be in a downtrend -> EURUSD is bottoming at the time of updating this post.
- Silver’s futures market may not show excessive concentration in terms of short positioning -> short positions were excessive until recently.
- Demand for physical silver needs to go through the roof -> confirmed.
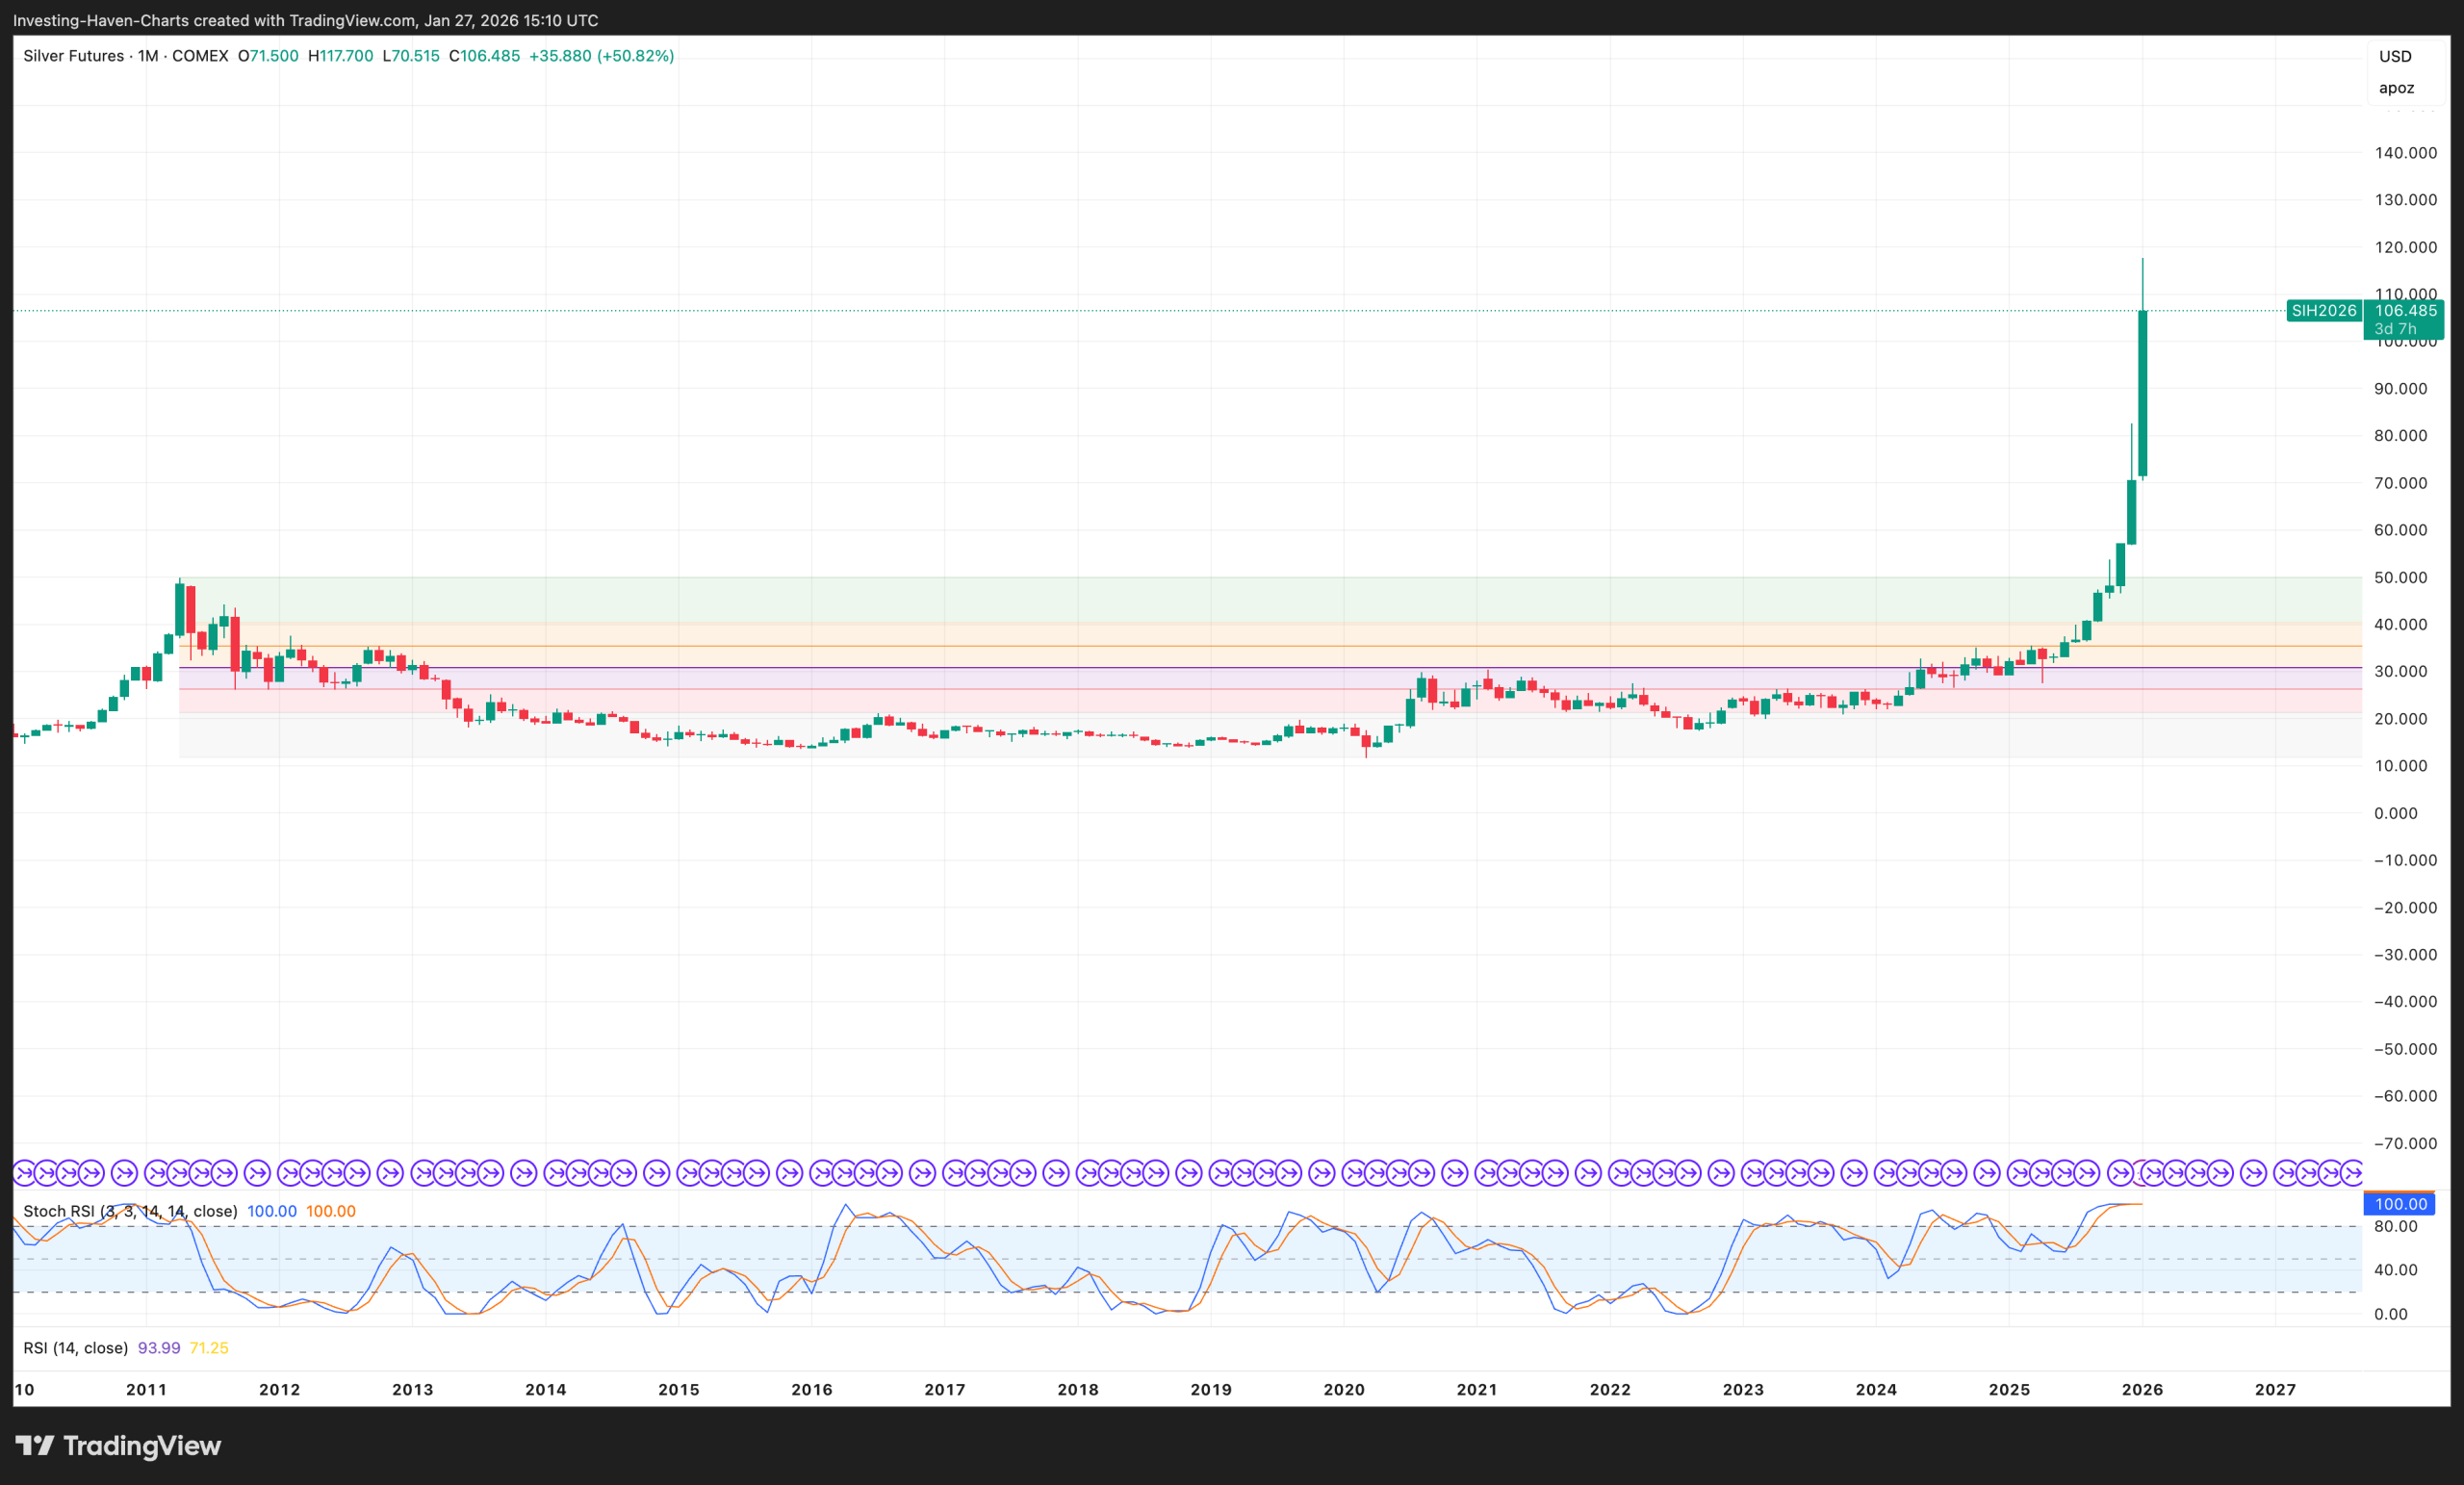
January 2026 – With the data at hand, all our 5 leading indicators are bullish, however we called these when SIlver was trading at $40, Silver is now trading over $110. Todays analysis suggests that we could see a sharp correction for Silver.
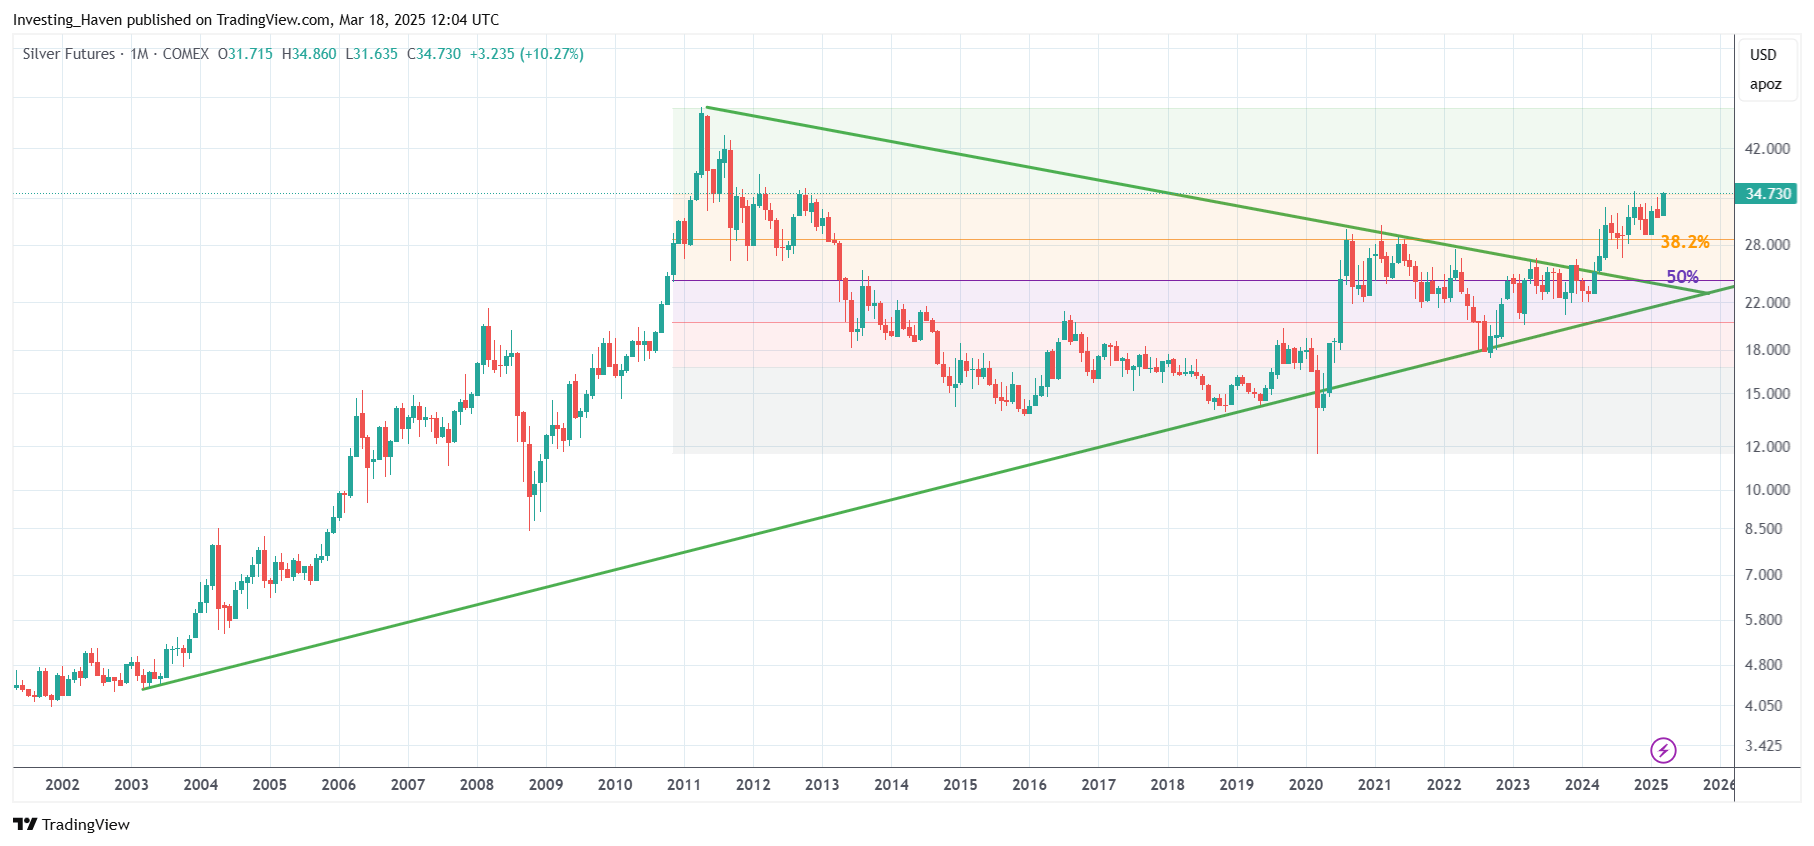
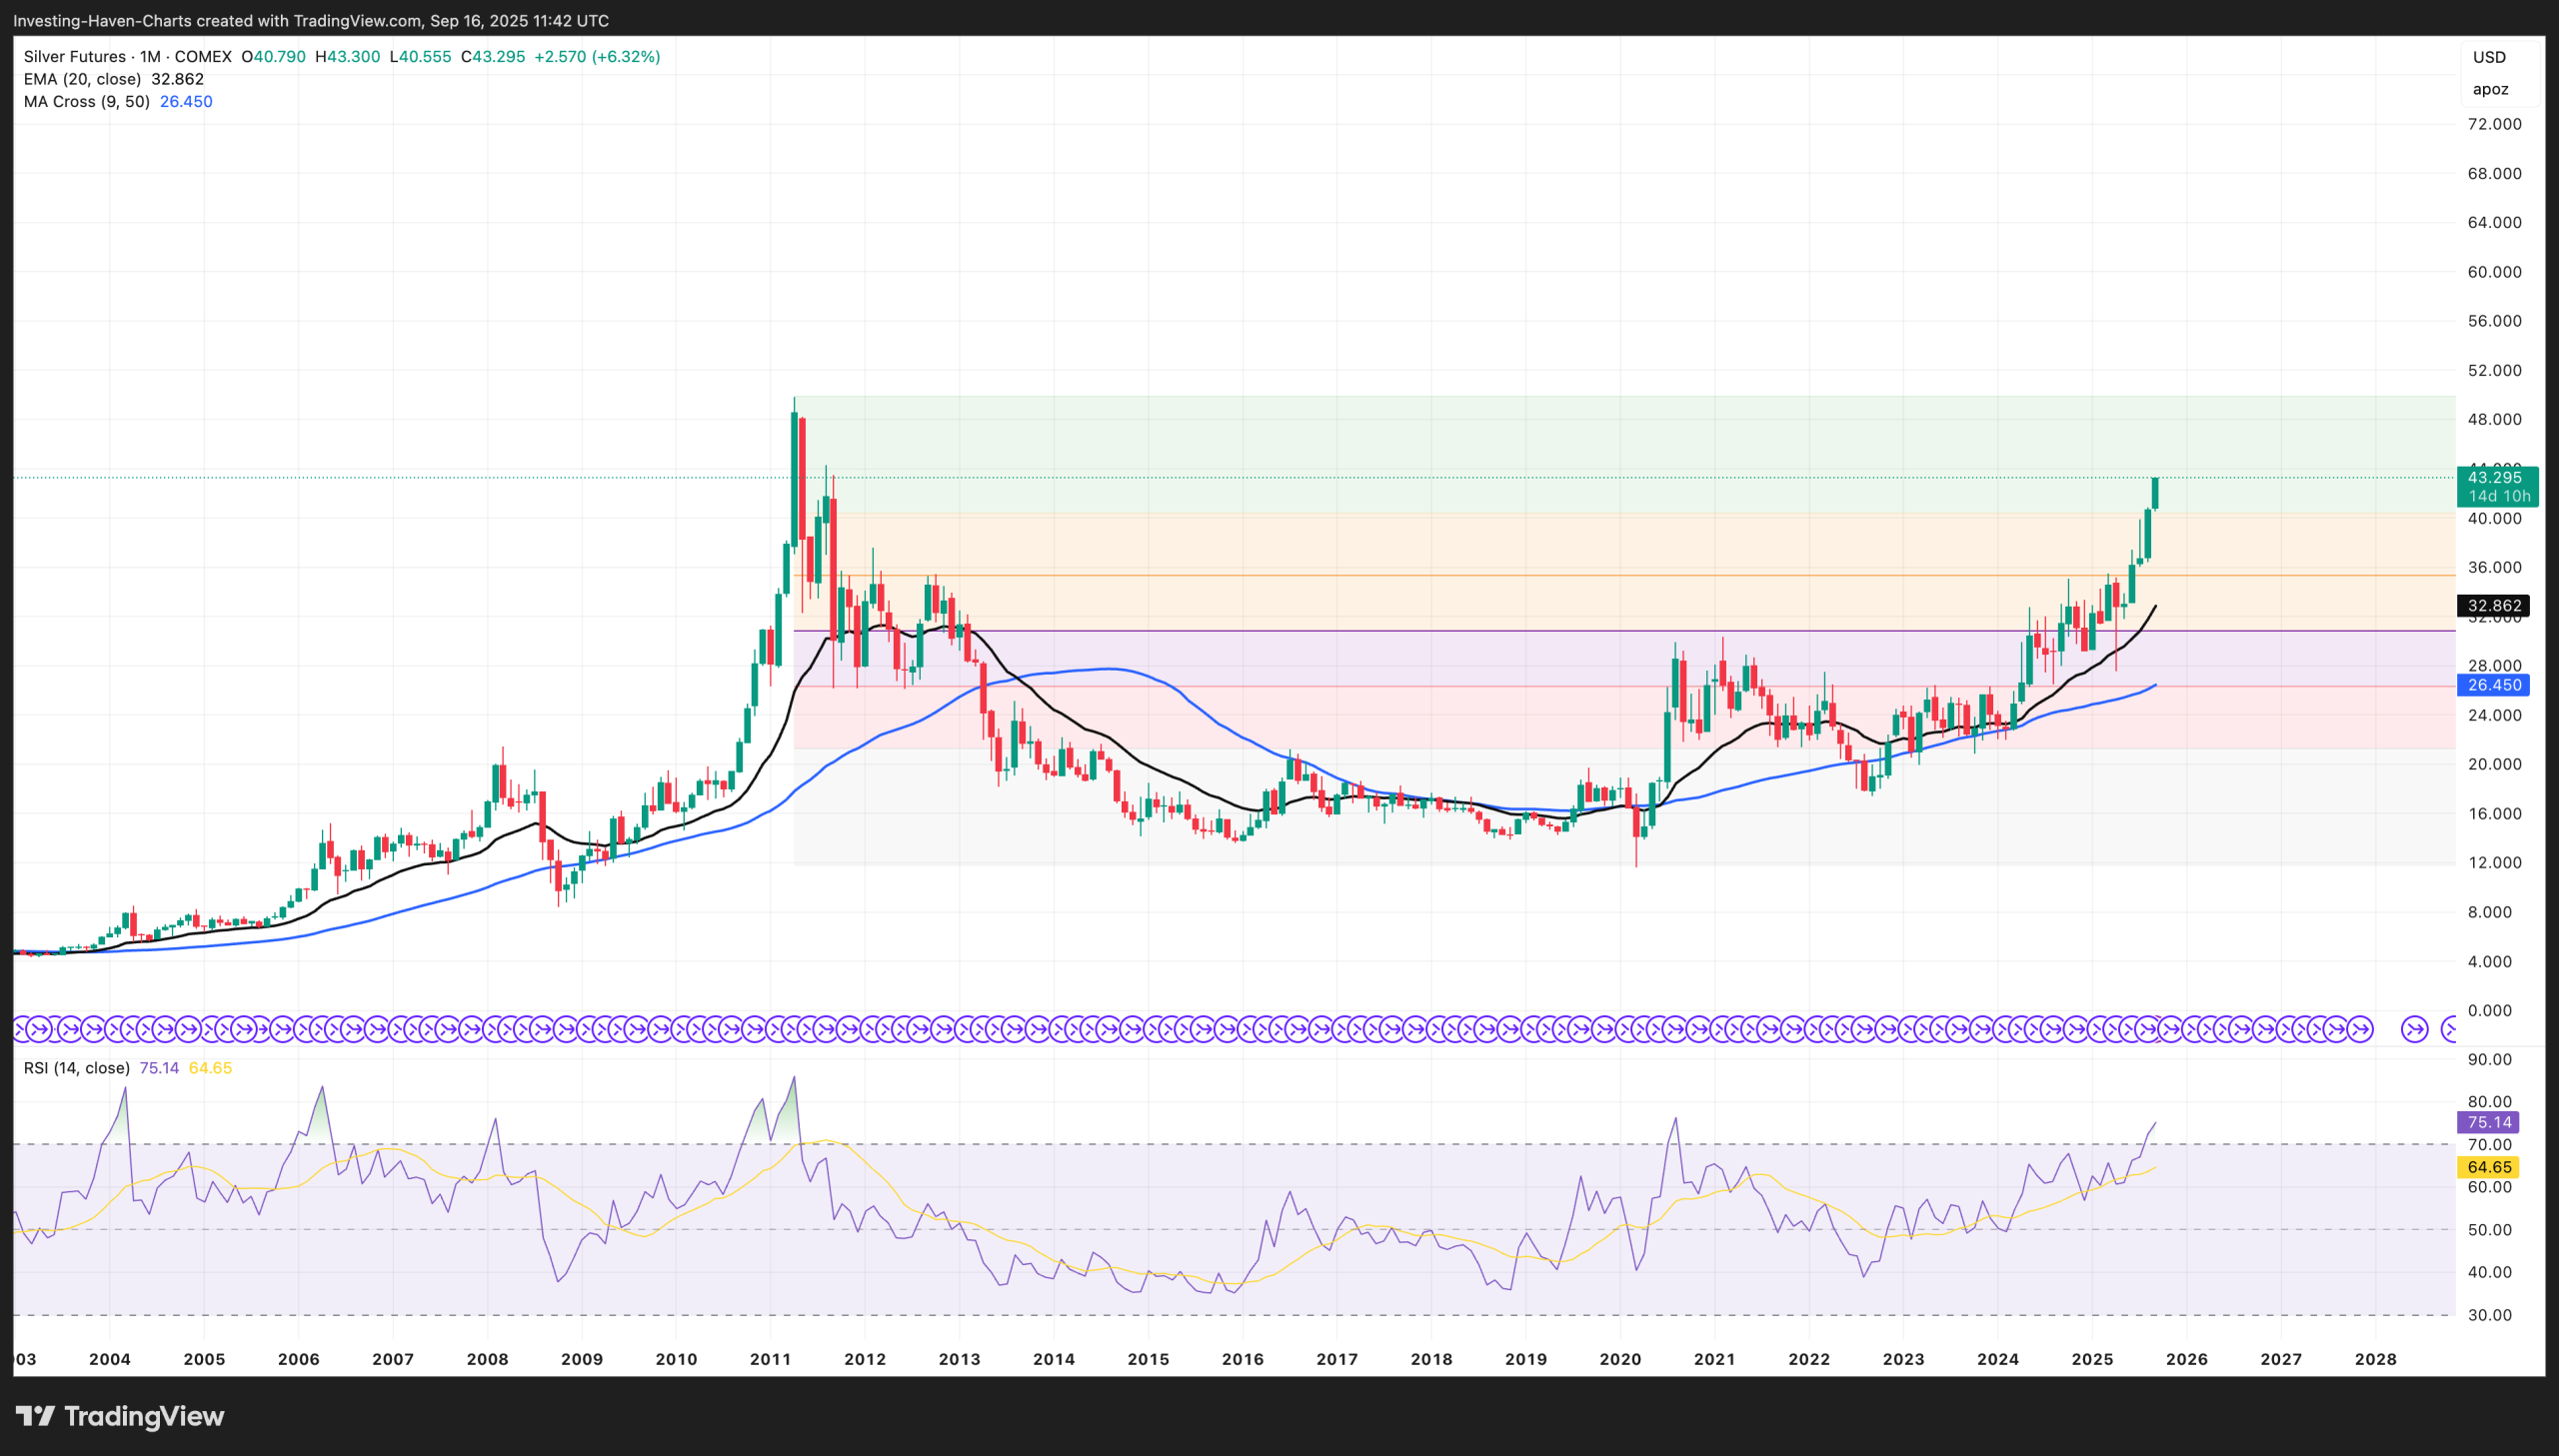
3. Silver charts supporting a bullish silver forecast
While many our silver prediction research requires chart analysis of many charts, there are 3 charts that truly stand. The following 3 charts tell a very bullish silver story.
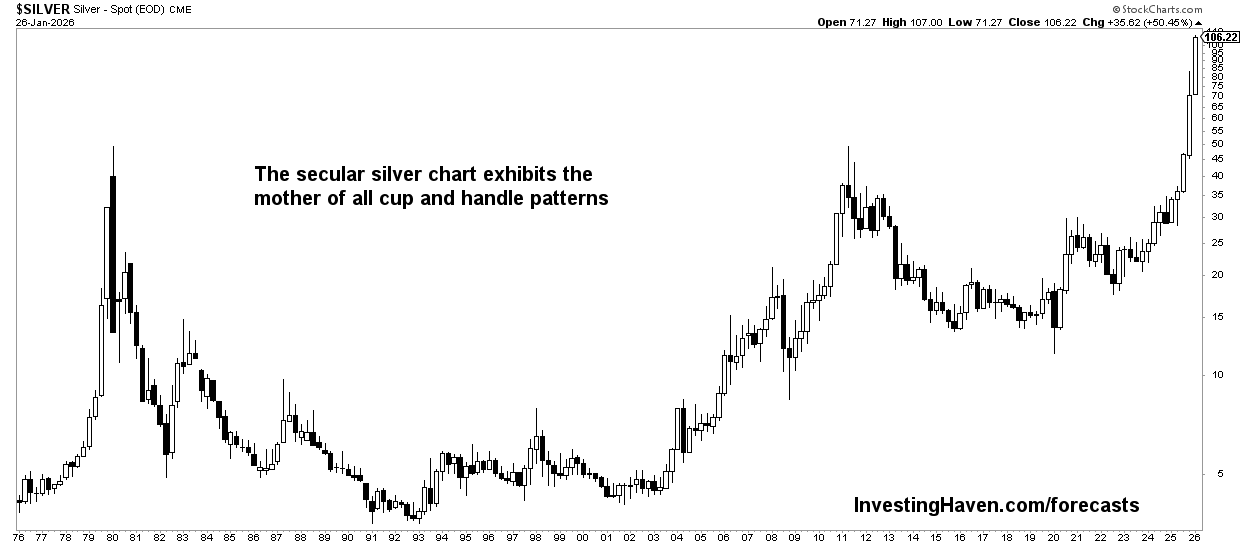
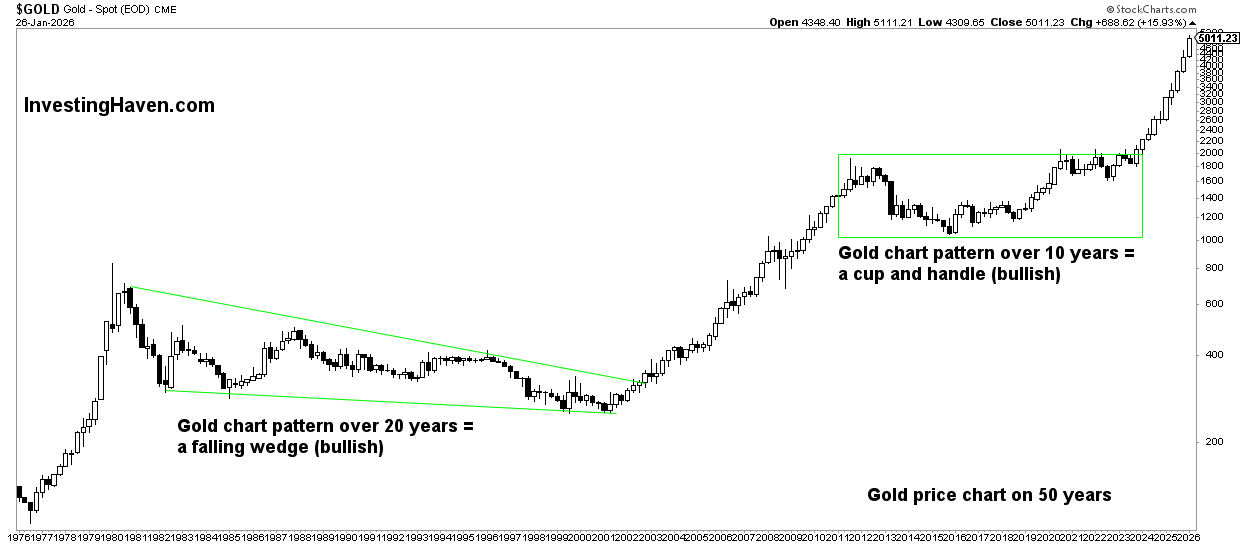
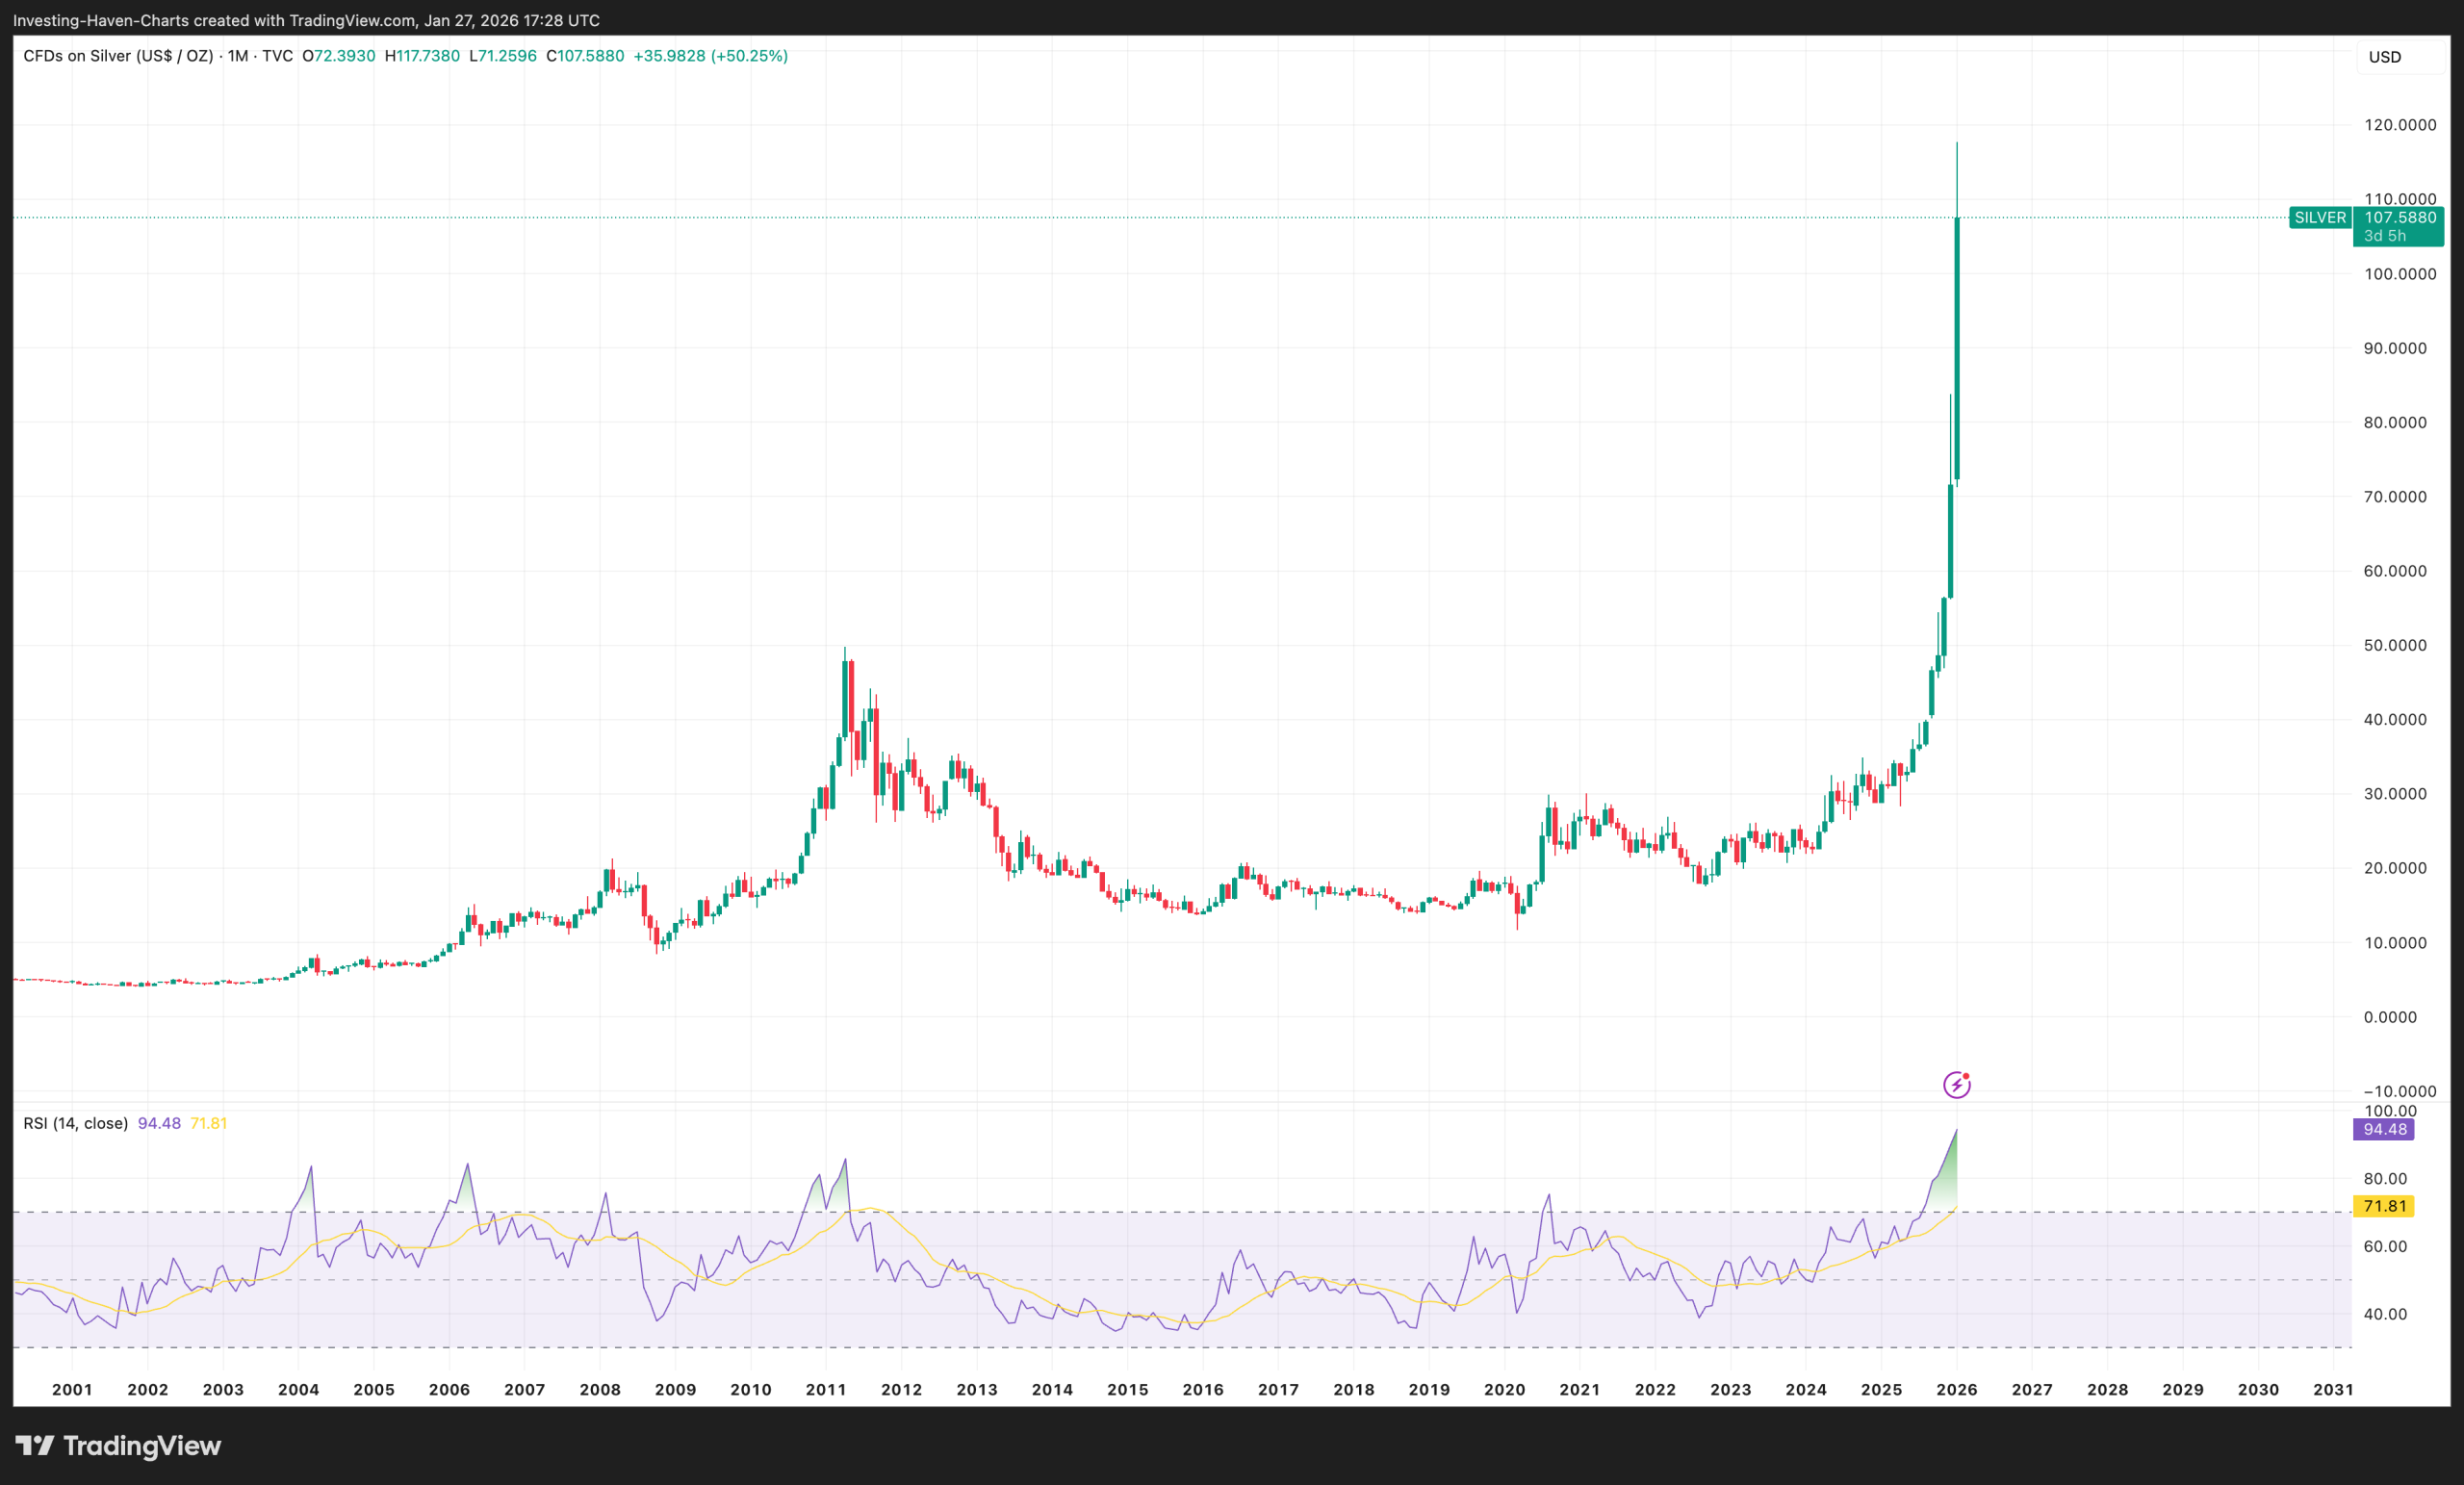
Silver’s secular price chart
The 50-year silver chart is shown below.
The chart pattern on this chart is a bullish cup and handle formation, ready to resolve higher.
While a bullish cup and handle chart structure is not unusual, what makes this chart setup so unusual and exceptional is the length of this chart pattern. There is not any other market nor stock or commodity that has such a strong bullish pattern over such a long period of time.
Janury 2026 – The silver breakout is what we expected and predicted however the scale of it has been beyond our expectations, our concerns are now that hype is driving the market at this point which makes it prone to a sharp correction.
Below you will see our updated version of a chart we published last year identifying the acceleration point for Silver.
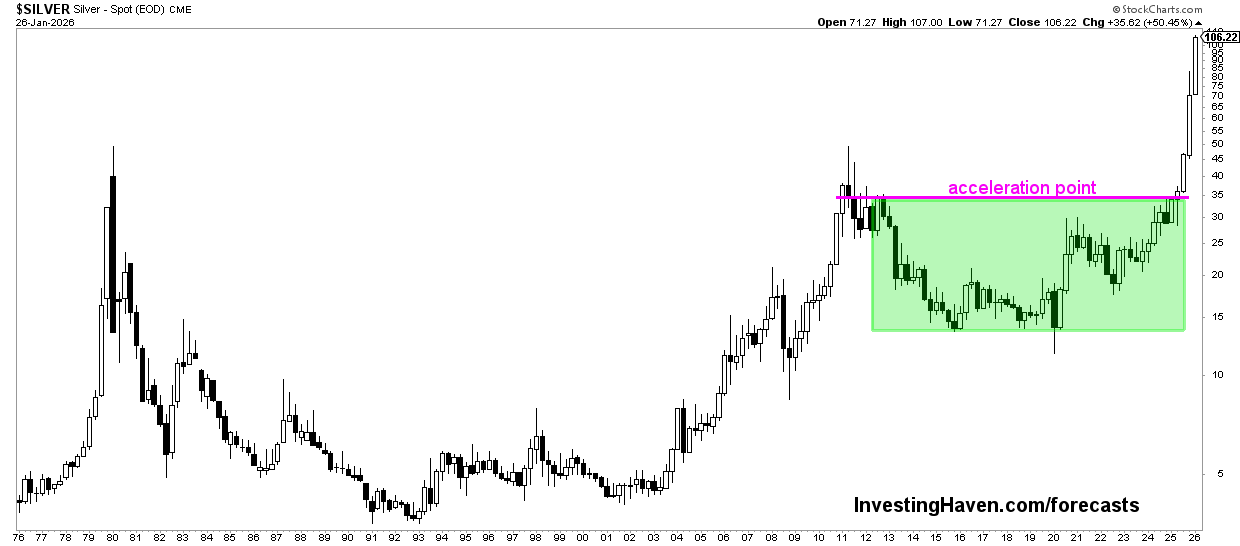
Three incredible Silver Charts Below
We look at three Silver charts that we have included in our Silver price forecast over the last years.
- You will see we identified the pattern back in March 2025
2. We updated our chart to show Silver accelerating.
3. Today Silver chart proved our analysis was correct.
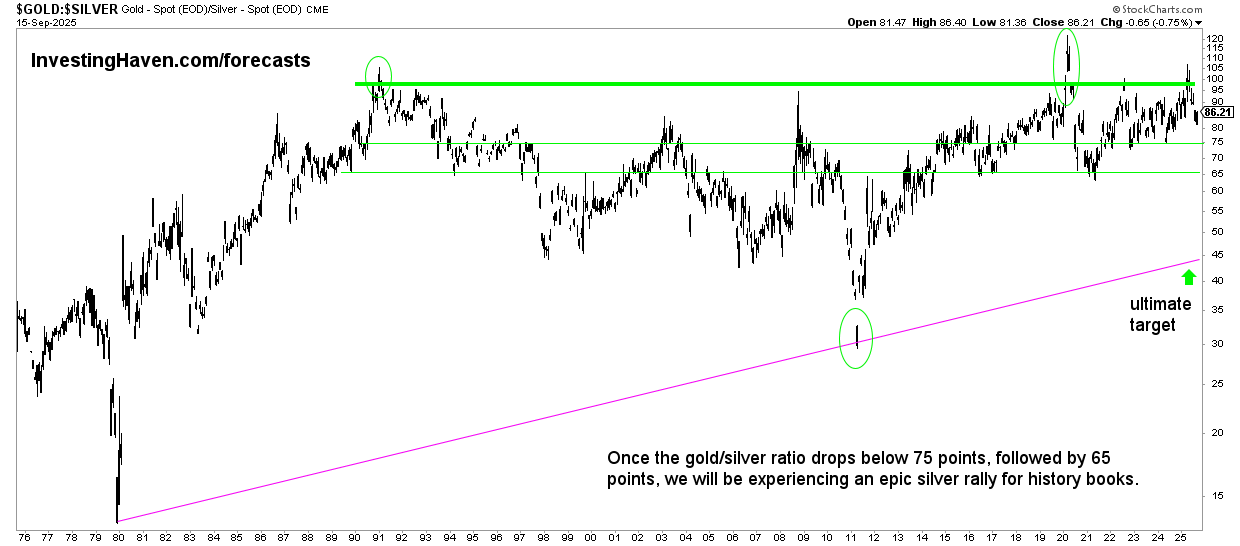
Gold to silver ratio secular chart
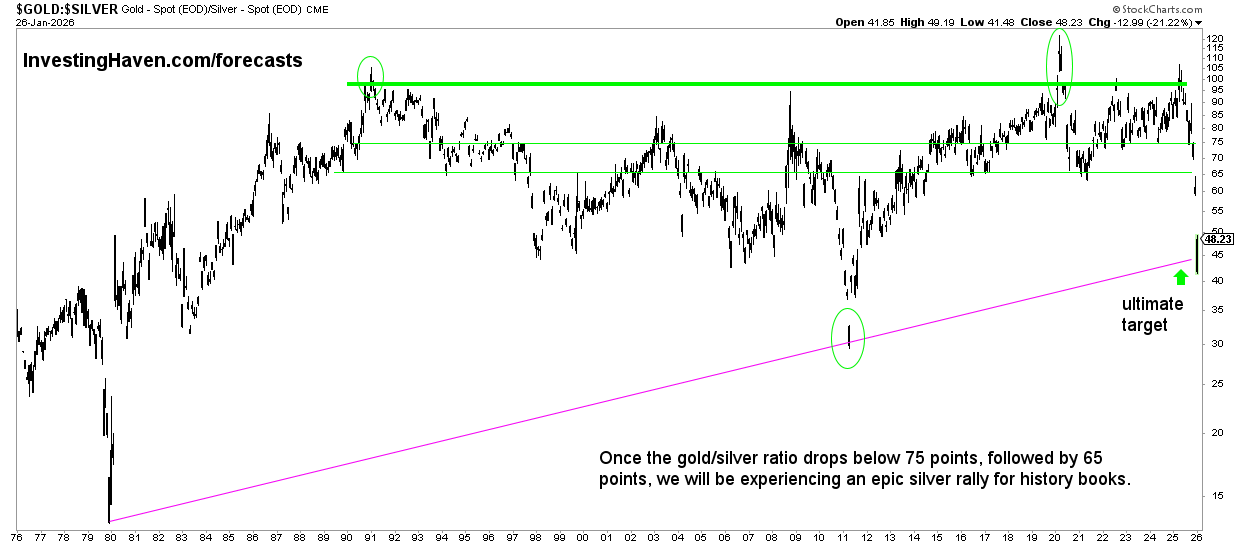
Below we will show two charts, one before the Rally and one after.
The gold to silver ratio, shown below, is sourced from our article Gold-to-Silver Ratio and Historic Silver Rallies:
The historical evidence suggests that the gold-to-silver ratio entering the 80 to 100x range may act as a signal for a significant rally in the price of silver. This ratio suggests that silver is extremely undervalued relative to gold.
The gold to silver ratio chart over 50 years is shown below. It can confirm a silver price prediction, directionally (it is not a timing indicator though).
A few insights that stand out:
- The gold to silver ratio tends to spend most of time in the area 75 to 95 points, see chart.
- Only exceptionally does this ratio drop below 65 points. Whenever the gold to silver ratio drops below 65 points, it tends to coincide with unusually strong spikes in the price of silver.
The following point was made in September 2025.
- The long term reversal is a very bearish M-pattern. It looks like the 4th and last leg of this ‘M-pattern’ is now underway. If this is true, then a sharp drop to 40 points is a matter of time. Silver will set new ATH if and when this will happen.
The gold to silver ratio is an amazing indicator in misleading the majority of investors. It is almost designed to ensure that the majority of investors will miss the historic silver rallies.
Our comments prior to 2026 – The gold/silver ratio remains flat, historically high. This discourages silver investors which is great news, especially since the gold market remains firm (silver has to follow, sooner rather than later).
January 2026 comment – The ultimate target has been confirmed and the Silver rally commenced.
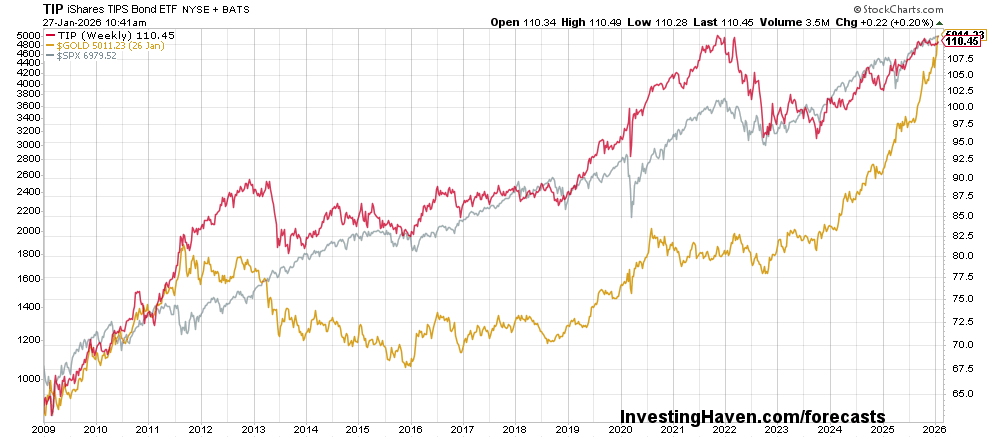
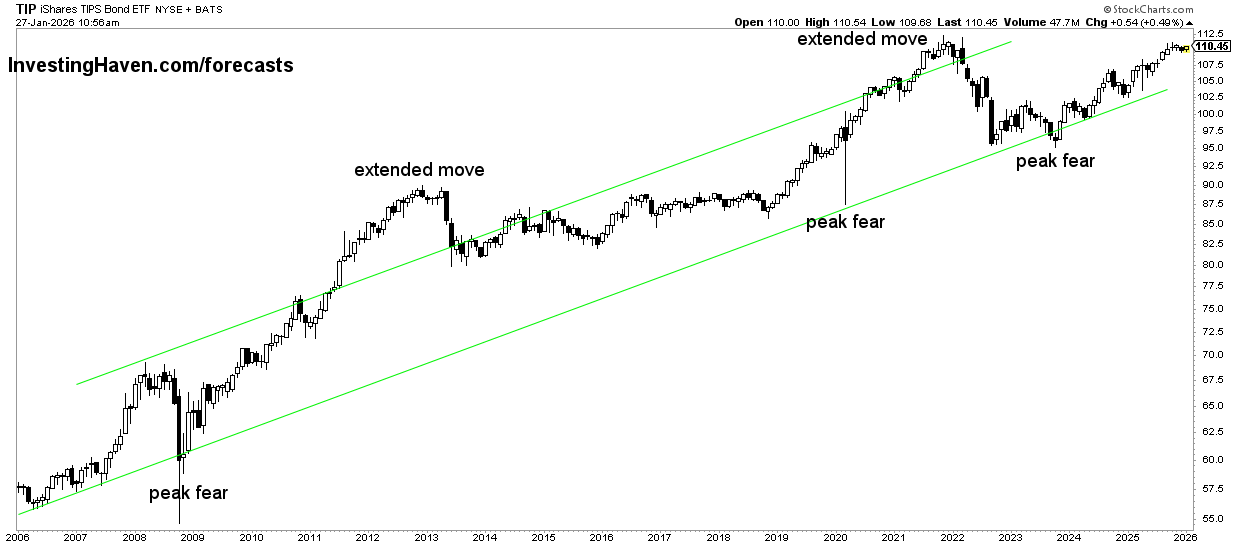
Silver’s correlation with gold and inflation expectations
Next up is the correlation between gold and inflation expectations (TIP). Even the S&P 500 is strongly correlated to gold and TIP.
In a way, this chart is the ultimate fundamental intermarket driver for silver!
January 2026 – The correlation between inflation expectations, gold and the S&P 500 is striking. This next chart visualizes the point that gold thrives in a bullish market environment and also economic growth. Contrary to common belief, gold needs good conditions, not economic uncertainty, in order to thrive. The chart below invalidates the perception (a myth) that gold needs economic uncertainty to perform well.
4. Silver leading indicator #1: Gold
There is no bull market in silver without a strong and secular bull market in Gold!
Gold must be in a bull market for silver to do what it’s good at.
A bullish silver price prediction requires a healthy gold bull market.
History has proven, over and over again, that silver is amazing in doing this:
- Mislead the majority of investors as they get discouraged of waiting for silver to move higher.
- Move sharply and suddenly higher, once the majority of investors give up, leaving ‘everyone’ behind.
- When FOMO kicks in and the majority of investors jump onboard, setting a major top.
In order to avoid the ‘major silver trap’ explained above, there is one important leading indicator to track – the grand bull market. Below is the secular gold price chart which has a message – the secular gold bull market is here!
January 2026 – Gold’s long term bullish market remains strong, arguably very strong. The gold bull market is now confirmed with 10 monthly candlesticks above the breakout level. Gold’s bull market, ultimately, will push silver to new ATH, is our investing thesis.
5. Silver’s leading indicator #2: Inflation expectations
The most important leading indicator to predict the price of silver is inflation expectations, assuming a gold secular bull market.
Inflation expectations are positively correlated with gold, consequently it’s a fundamental driver for the price of silver.
The chart shown below visualize our point:
- Any sharp silver price drop in the past occurred when inflation expectations (TIP) were declining.
- Rising silver prices require inflation expectations (TIP) to trend higher.
As long as inflation expectations keep on rising, directionally (not on a day-to-day basis), the odds keep on rising that silver will move to ATH. This indicator is a critical one for a bullish silver price prediction.
January 2026 – The fundamental catalyst for gold and silver is inflation expectations (TIP ETF). As 2026 comes into Q1, this catalyst remains supportive for gold and also silver. Precious metals investors want to see TIP ETF moving within its perfectly rising channel, with max. 3 monthly closing prices below support of the rising channel.
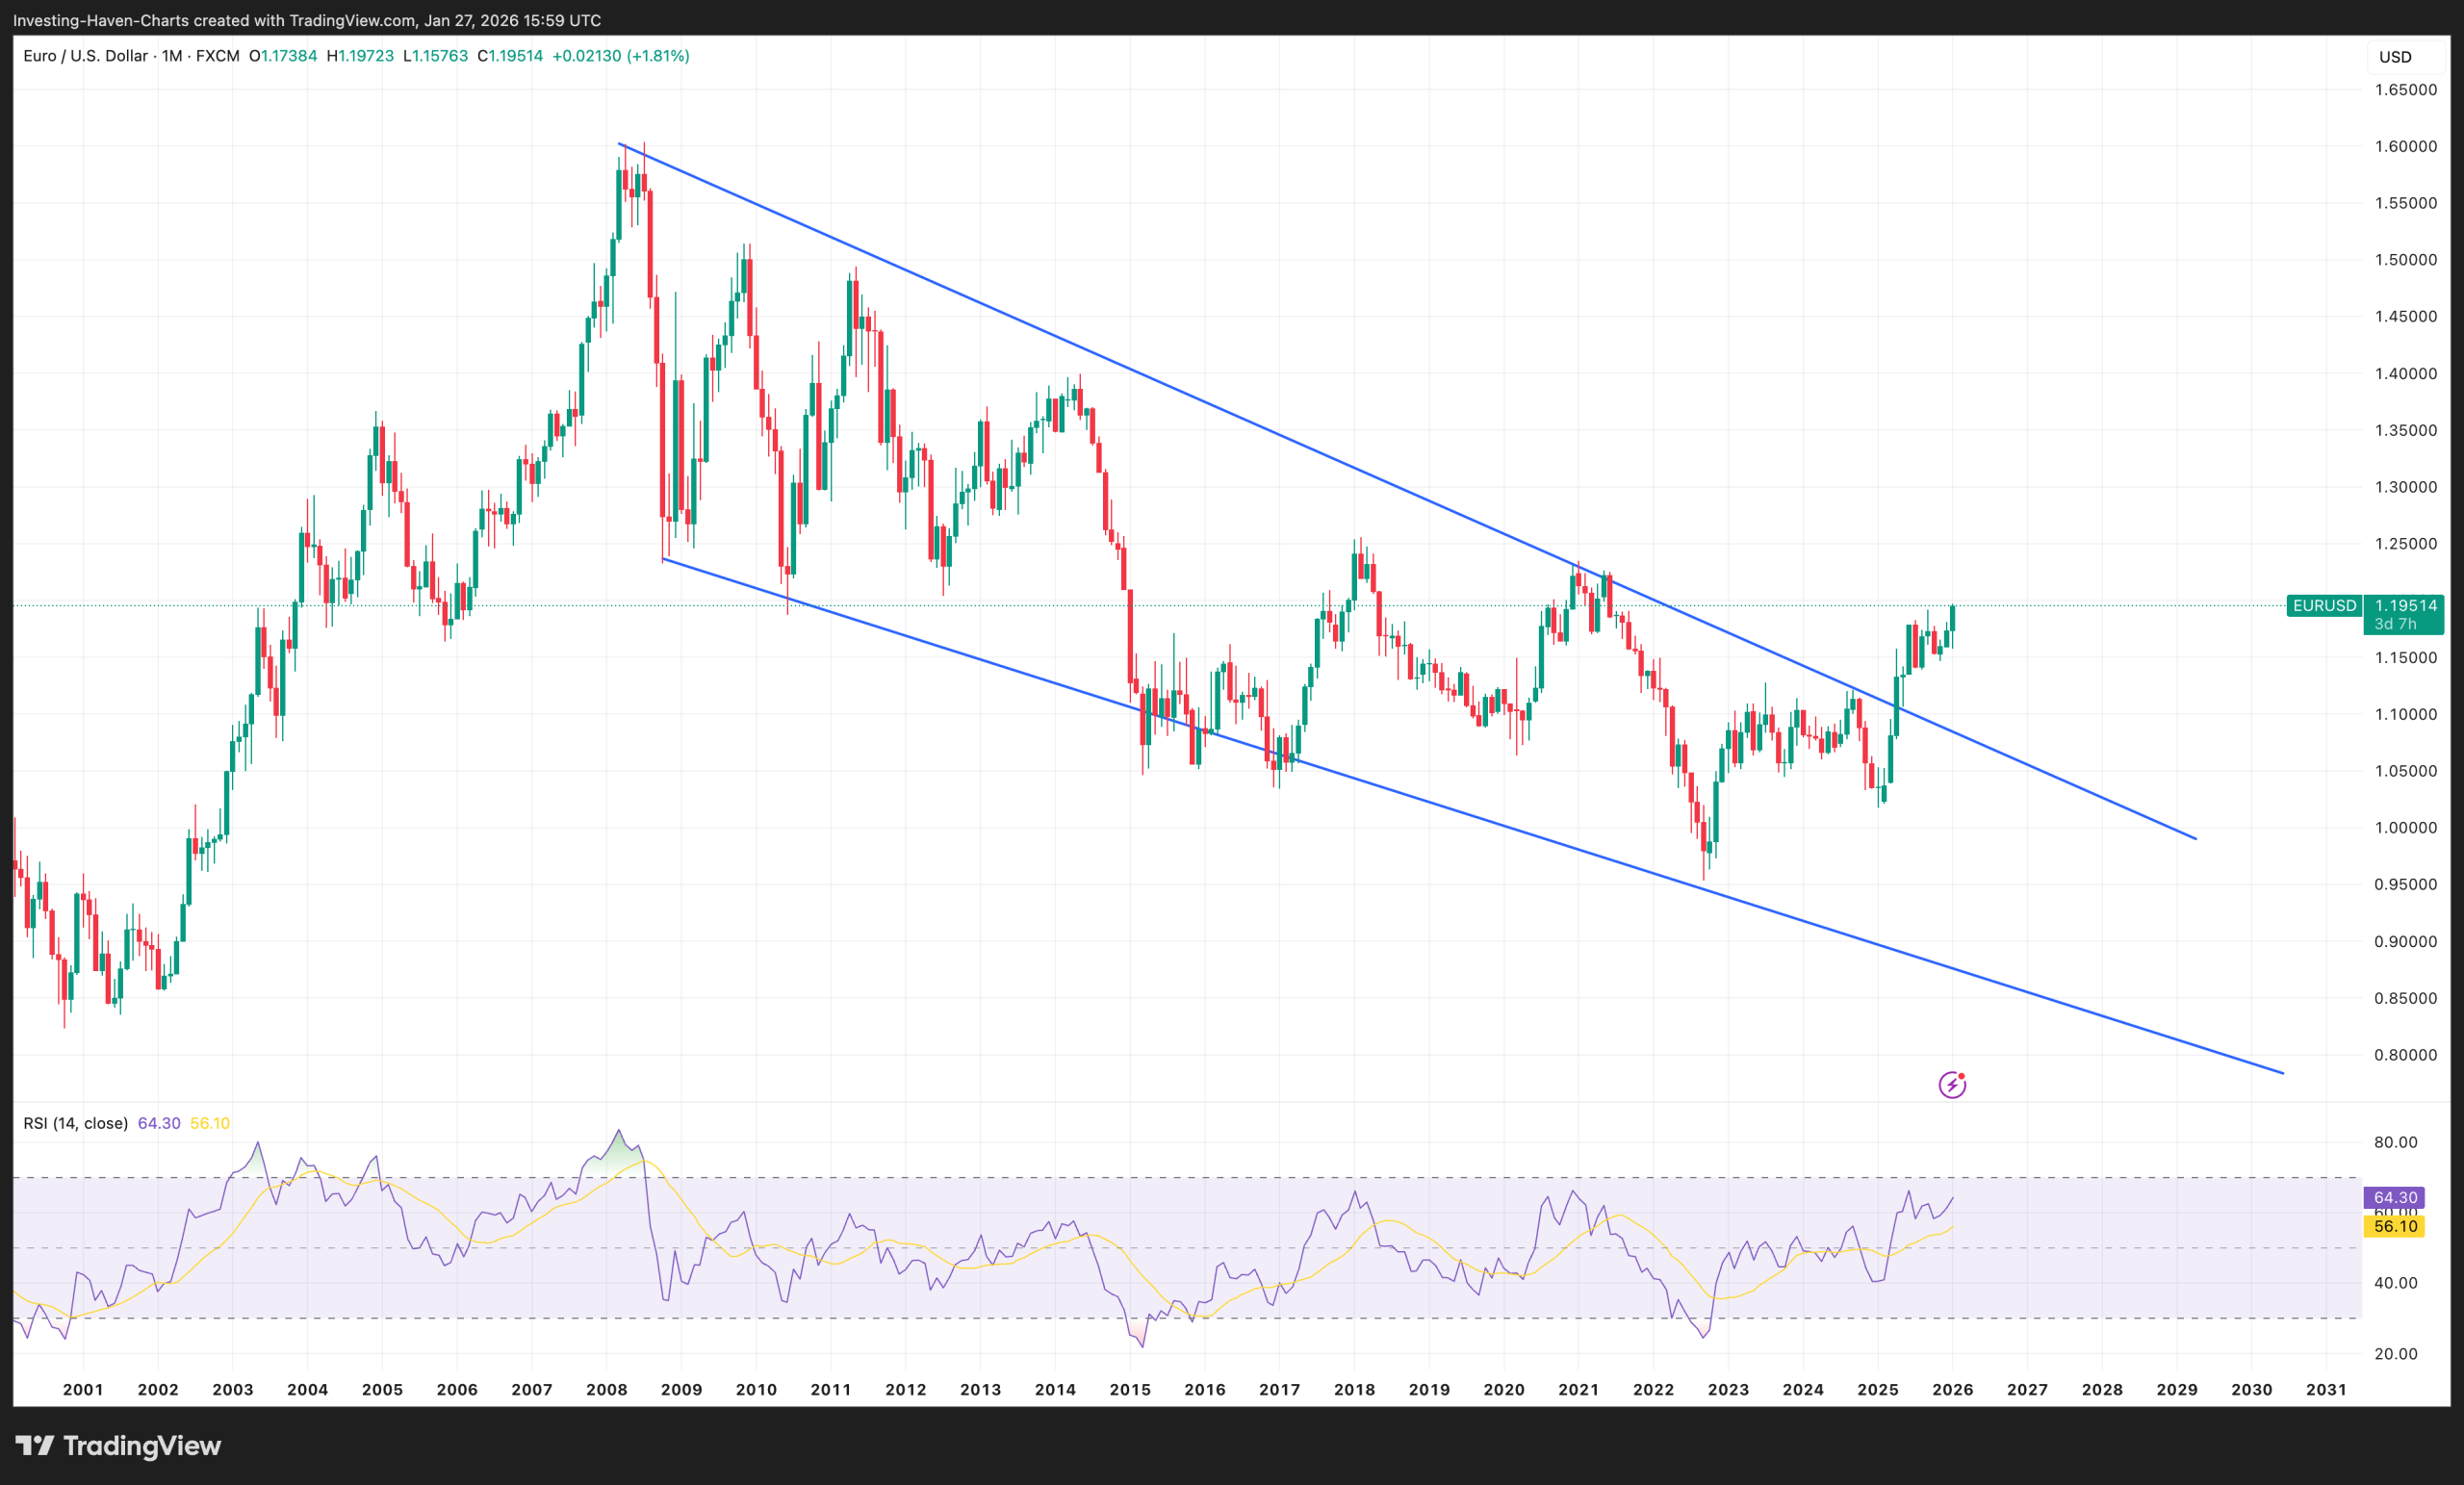
6. Silver leading indicator #3: EURUSD
Precious metals need a rising or flat EURUSD in order to shine. We observe a consolidation on the EURUSD chart, supporting a bullish silver price prediction.
Conversely, precious metals cannot rise if the USD is strongly trending higher.
If we look at the secular EURUSD chart, indicating its long term trend, we observe:
- An ongoing consolidation in 2026.
- A strong bounce since 2023.
This is very supportive for precious metals. There is a low probability for the USD to stage a strong bull run (which would bearish for precious metals).
January 2026 – The secular EURUSD chart is an important indicator for the gold price, especially at times when the EURUSD is falling fast. Back in 2008, 2013, 2022, the EURUSD noticed significant declines which resulted in large drops in the price of gold & silver. The rule of thumb, on the highest timeframe, is that the EURUSD should not be in a steep decline in order to create a supportive environment for gold & silver. At the time of updating this post, the EURUSD has broken above the falling trendline.
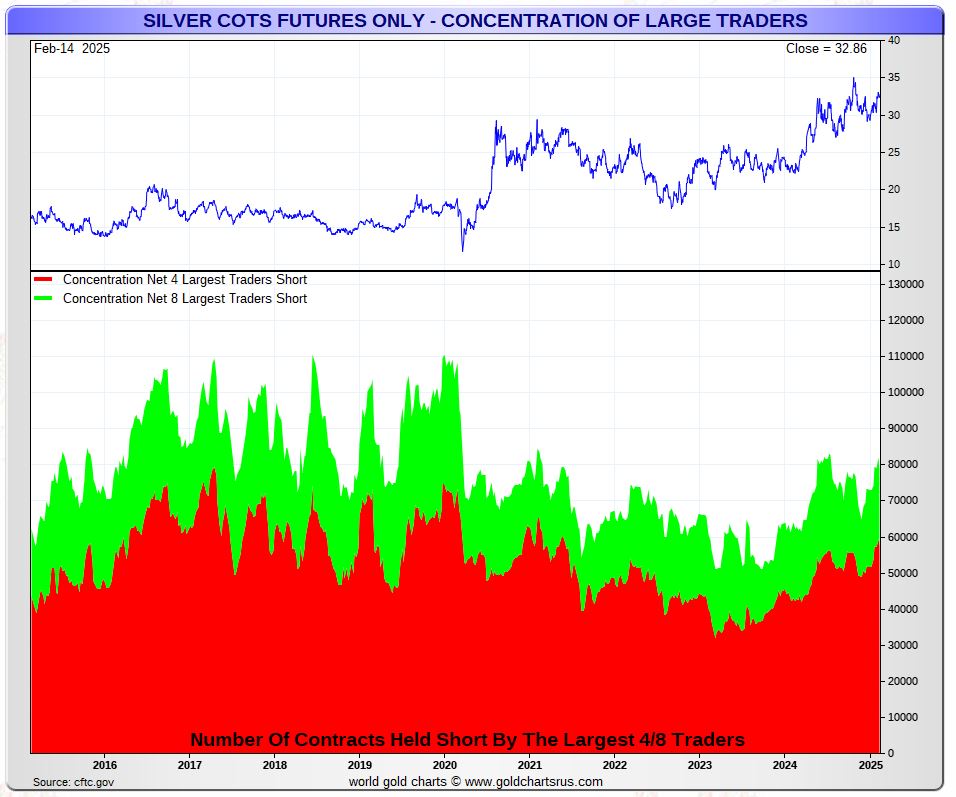
7. Silver leading indicator #4: Futures market
One specific data point in the silver futures market is concentration of traders shorts. As long as this reading is not excessive, there is upside potential in the price of silver.
We explained this leading indicator in this article:
Silver: This One Leading Indicator Confirms Massive Upside Potential In 2025
Below is the chart visualizing concentration of the largest traders short in the silver futures market. It is easy to observe the dynamics that this leading indicator creates, and correlation with the price of silver:
- Concentration was extremely high back in 2017 – the price of silver was unable to rise.
- Concentration dropped in 2018 and started rising again in 2019 – the silver price followed a similar path.
- In each of these occurrences, the price of silver came down once extremely high levels of concentration were touched.
This leading indicator is nowhere near extremes. It suggest that significant upside potential in silver, maybe even massive upside potential, in 2025 and 2026. This data point supports a very bullish silver price prediction.
February 18th 2025 – This data out of the silver futures market shows that concentration among the largest traders net short are on the rise. They have a very long way to go until they hit extremes (which will become bearish for the price of silver). This indicator requires watching. It seems almost as if the largest traders short are preparing for a large consolidated silver short position as silver heads to $50, for them to sell big at $50 when many retail investors will be entering (and they will be hit, as always, by the whales).
8. Silver leading indicator #5: Physical silver market
The ongoing silver shortage in the physical silver market keeps on ‘deteriorating’, supporting the silver bull market thesis.
Sometimes, it pays off to keep things simple. How much more research do we need to bring the point home – this post on $SILVER says it all:
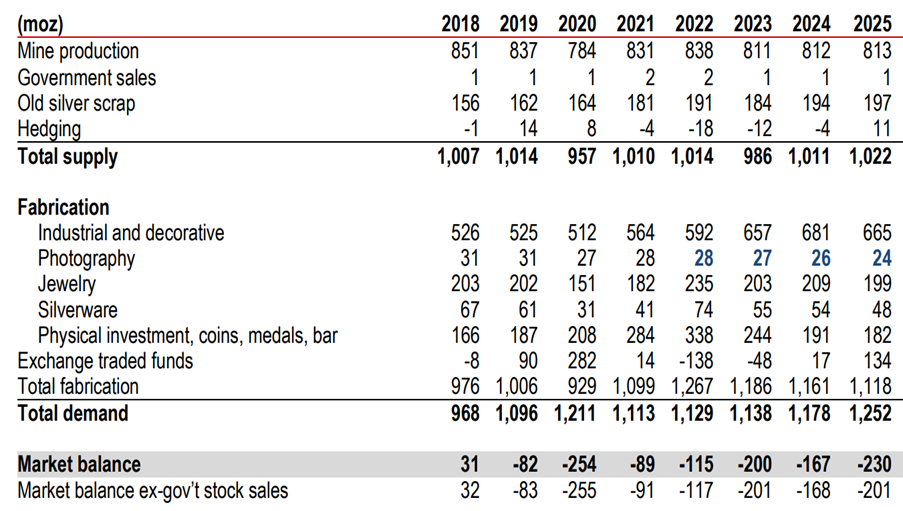
Latest Silver Institute estimate: a deficit of 282 million ounces for 2024, the sixth consecutive year of deficits, and the largest since the blowout figure in 2020.
Note how the shortage is increasingly driven by industrial uses (especially in the past four years) – sectors… pic.twitter.com/RujVhsmnH8
— HK Nik (@hk_nik) November 14, 2024
Here is the CEO of Dolly Varden, a respected silver miner, backed respected investors including Sprott, coming out and talk about a potential silver supply squeeze brewing.
The shortage did not resolve in 2024. In fact, there is an increasing number of signs that the shortage is only intensifying. Sooner rather than later, silver’s physical market shortage should be reflected in the price of silver.
Here are the latest figures to see the supply vs Demand for Silver over the last 8 years to back up this statement.
9. Silver price chart: the most powerful reversal in history?
Are you ready for a bold statement? There you go: Silver Long Term Chart Is The Most Powerful Bullish Reversal In History.
With the risk of repeating ourselves to the point of losing our readers’ focus, we show once again the long term silver price chart.
Below is the secular silver chart, without annotations:
- This chart setup is extraordinary.
- We cannot emphasize enough how powerful this structure is.
- Powerful equals upside potential.
As seen on below chart, a giant cup and handle formation is unfolding on the silver chart. That’s why we conclude that silver qualifies as THE investment opportunity of this decade.
September 2025 Comments – The longest term silver price chart has this unusually long (hence strong) cup and handle reversal pattern. It suggests that silver will ultimately move to ATH. Ultimately, it will exceed ATH, investors have to be patient though.
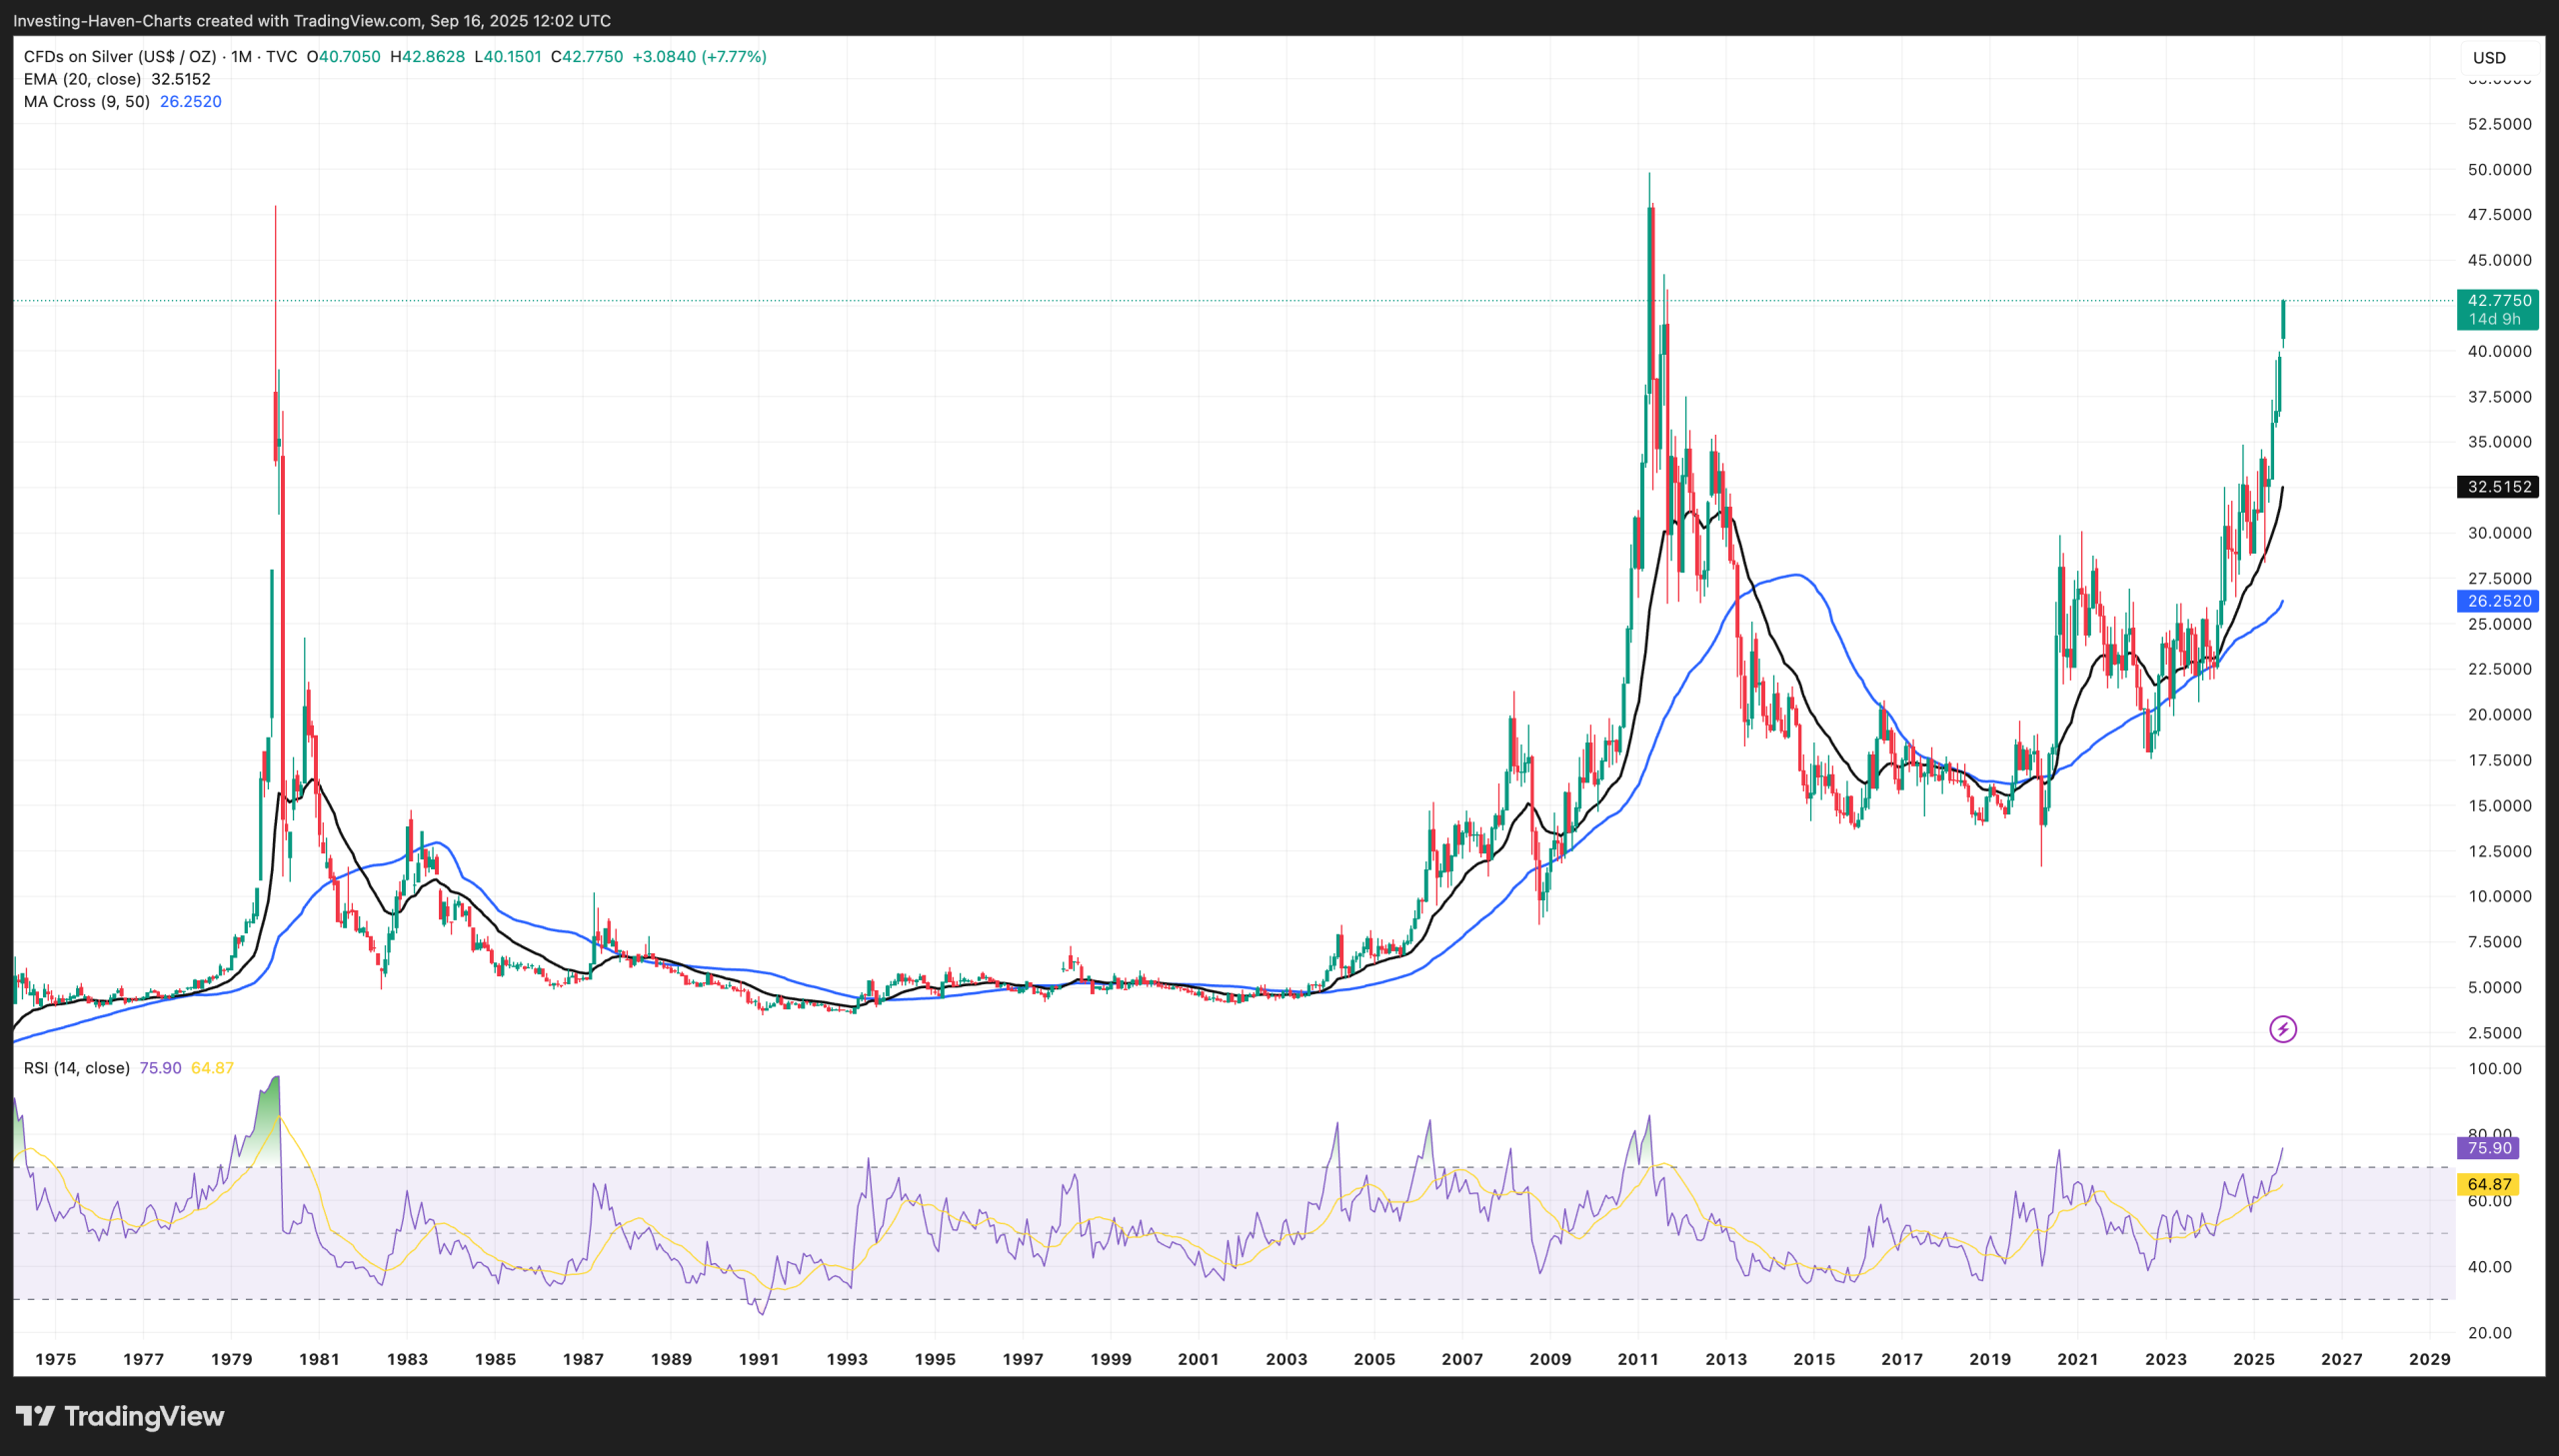
September 2025 Comments – The rally has been ultra bullish for Silver in 2025 and the start of 2026. It’s quite possible that a new ATH of circa $150 could be hit but there is also a strong potential for significant retracement.
10. A global silver bull market is already here
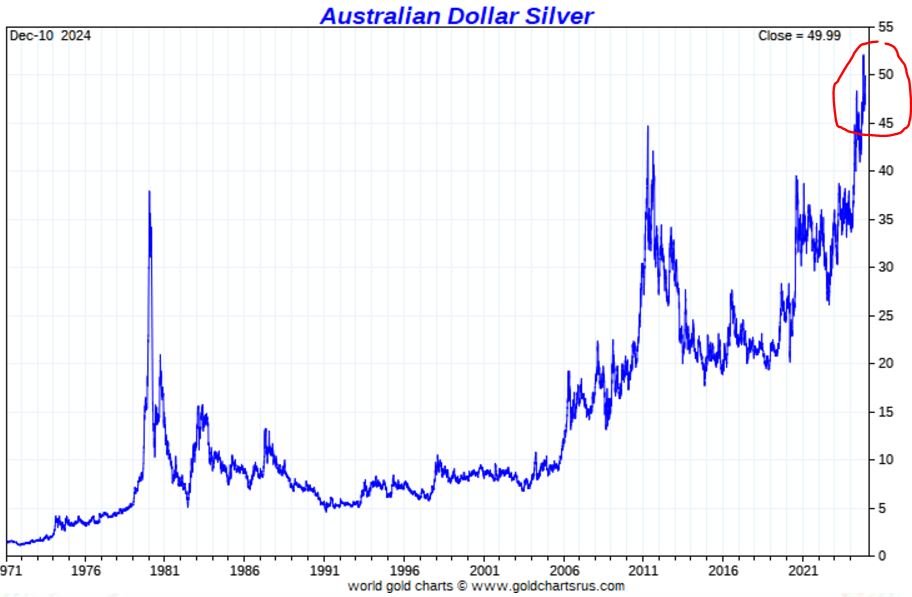
While many investors were waiting for a silver bull market to take off, we are on record stating that the global silver bull market is already here!
We explained our viewpoint here – Silver Reaches All-Time Highs in Most Global Currencies.
There is some sort of optical illusion when looking at the silver market through the lens of silver priced in USD.
What investors will miss is that silver priced in several global currencies has set fresh new ATH in 2024.
Case in point – silver made new ATH when priced in Australian Dollars, Indian Rupee, Russian Ruble, South African Rand. One illustration is shown below. Silver priced in GPB, EUR, CAD trades right below ATH.
The silver market looks very different when looked at it in global currencies (non USD).
February 18th 2024 – Silver priced in global currencies is hitting new ATH. Below is silver in AUD, but there are plenty of other currencies where silver is already setting new ATH since a while. Silver in USD has to follow, sooner rather than later.
11. Silver price forecast: overview & conclusion
Silver charts combined with silver price leading indicators confirm a strongly bullish silver story.
A mildly to wildly silver bull market can be expected in the period 2025 through 2030.
The overview of our silver price prediction research:
- Secular silver price charts – the most powerful bullish reversal ever.
- Gold bull market – silver needs a secular bull market in gold which seems here to say.
- Silver prices in global currencies – the silver bull market is already here, not yet in silver priced in USD.
- Fundamental silver price driver – inflation expectations trending in a long term rising channel.
- Silver price leading indicator in the currency market – the EURUSD is flat to bullish, supporting gold & silver.
- Silver futures market – concentration of the largest traders short is the biggest enemy for the price of silver, current readings allow for much more upside potential in the price of silver.
All leading indicators, chart patterns and market dynamics are in favor of silver. We conclude that the price of silver will continue to mildly rise, combined with one or a few wildly bullish periods.
Silver price prediction overview:
This is our forecasted silver price for the coming years:
| Year | Silver price prediction |
|---|---|
| 2025 | $27.90 to $50.25 |
| 2026 | $37.40 to $50 |
| 2027 | $44.40 to $75 |
| 2028 | $80 |
| 2030 | Peak price: $80 |
12. Silver forecasts from financial institutions
This section allows readers to compare the silver price prediction from InvestingHaven.com with silver forecasts from financial institutions specifically for 2025:
- ANZ Research predicts silver to range between $33.2 and $35.4
- JP Morgan predicts silver in 2025 to average $36.
- ING forecasts a silver price of $29.5 in 2025.
- Saxo Bank predicts a silver price of $40 in 2025.
- World Bank analysts foresee a 7% rise in the silver price in 2025.
- Wahyu Laksono predicts silver to trade between $30 and $40.
- Amrapali Group’s Chirag Thakkar foresees a silver price of $35 to $37 in 2025.
Clearly, InvestingHaven.com is way more bullish than all financial institutions combined. And so is Rick Rule.
Surprisingly, there are not a lot of financial institutions releasing a silver price prediction for 2025. This short list, shown above, is much shorter than the list of gold price predictions for 2025 published by large banks.
Outside of the universe of financial institutions, we find the following silver price predictions:
- Mind Money CEO Julia Khandoshko forecasts a silver price of $40 to $50 in 2025.
- Peter Krauth, editor of Silver Stock Investor, predicts $40 in 2025.
More 2025 silver predictions will be added as they come online.
13. Silver Correction Prediction
14. Silver price predictions FAQ
Is it a good idea to invest in silver in 2026?
Per our silver prediction research, the odds are high that silver will experience bullish momentum in 2026 and beyond. Buy the dip, before the point of acceleration kicks in, because silver will suddenly move fast and furiously higher.
Which is a stretched silver price target?
We believe that silver may move to $150 an Ounce, at some point before 2030, driven by rising inflation expectations. The obvious pre-requisite is that silver clears $100, a point where volatility will kick in, not easy to clear but not impossible.
Is the silver price prediction sponsored?
Not at all. InvestingHaven.com is independent, not affiliated with any site or institution, as evidenced by the absence of advertisements. Our silver price prediction is based on a forecasting method that has been refined over 2 decades.
Why not stick to X for silver predictions?
The charts shared on the cash tag $SILVER on X are of very low quality. They miss the point about dominant chart patterns. Moreover, the majority of those charts are very short term oriented. At least 99% of silver related content on X qualifies as noise for serious investors. Here is one interesting silver post confirming that silver may able to rise very fast (one of the few long term oriented posts), confirmed by this tweet with chart. Note that news items like this silver article by Reuters is often also not adding any value.
Premium silver price analysis – receive weekly alerts
Our public blog posts typically share high level insights that are not actionable. For actionable insights, we recommend considering our detailed gold & silver price analysis. It is a premium service, covering leading indicators of the gold price and silver price. Premium service: Gold & silver price analysis >>


