Investing Haven
No Result
View All Result
Gold Silver Investing >>
CRYPTO INVESTING >>
  • 2025 Forecasts
    • 10 market predictions
    • Dow Jones forecast
    • S&P 500 forecast 2025
    • Nasdaq prediction 2025
    • Best altcoins to buy
    • Best crypto to buy now
    • Which crypto will explode
    • 15 crypto forecasts 2025
    • Which precious metal to buy
  • Silver
    • Silver prediction 2025 – 2030
    • Will silver exceed $30?
    • When will silver hit $50?
    • Can silver hit $100?
    • Silver shortage
    • 50-year silver chart
    • Silver bullish reversal
    • Silver seasonality charts
    • How to invest in silver
  • Gold
    • Gold prediction 2025 – 2030
    • Will gold set new ATH?
    • Will gold hit $3,000?
    • Can gold hit $10,000?
    • Gold chart 10 years
    • Gold chart 50 years
    • Gold chart 100 years
    • Gold silver ratio
    • Gold seasonality charts
  • Commodities
    • Coffee forecasts
    • Sugar forecasts
    • Nickel forecasts
    • Lithium investing
  • Crypto forecasts
    • BTC prediction 2025 – 2030
    • ETH prediction 2025 – 2030
    • SOL prediction 2025 – 2030
    • XRP prediction 2025 – 2030
    • XLM prediction 2025 – 2030
    • BNB prediction 2025 – 2030
    • ADA prediction 2025 – 2030
    • AVAX prediction 2025 – 2030
    • KAS prediction 2025 – 2030
    • NEAR prediction 2025 – 2030
    • BCH prediction 2025 – 2030
    • LINK prediction 2025 – 2030
    • DOT prediction 2025 – 2030
    • SUI prediction 2025 – 2030
    • ICP prediction 2025 – 2030
    • LTC prediction 2025 – 2026
    • STX prediction 2025 – 2030
    • DOGE prediction 2025 – 2030
    • SHIB prediction 2025 – 2030
    • PEPE prediction 2025 – 2030
    • FLOKI prediction 2025 – 2030
    • WIF prediction 2025 – 2030
    • ONDO prediction 2025 – 2030
  • News
    • Crypto news
    • Commodities
  • Login
Investing Haven
No Result
View All Result

Home » Forecasts » Value vs. Growth: What Do The Charts Suggest For 2022?

Value vs. Growth: What Do The Charts Suggest For 2022?

Taki T. by Taki T.
April 17, 2022
in Forecasts
bull with mask
1.9k
VIEWS
Share on FacebookShare on Twitter

Growth stocks have been beaten down in the last 4 to 5 months. Many value stocks did well, some did very well. In our Momentum Investing long term stock tips we saw insanely bullish performance of our lithium and cobalt top picks, in the value segment. The million dollar question is whether we have a ‘new normal in markets‘ or whether this was a temporary blip in growth stocks? As per our forecast based on the 100 year Dow Jones chart we believe that not only value stocks should do well in 2022 but most stocks should do well, also growth.

In looking for the answer to the question value vs. growth we noticed a few really interesting things.

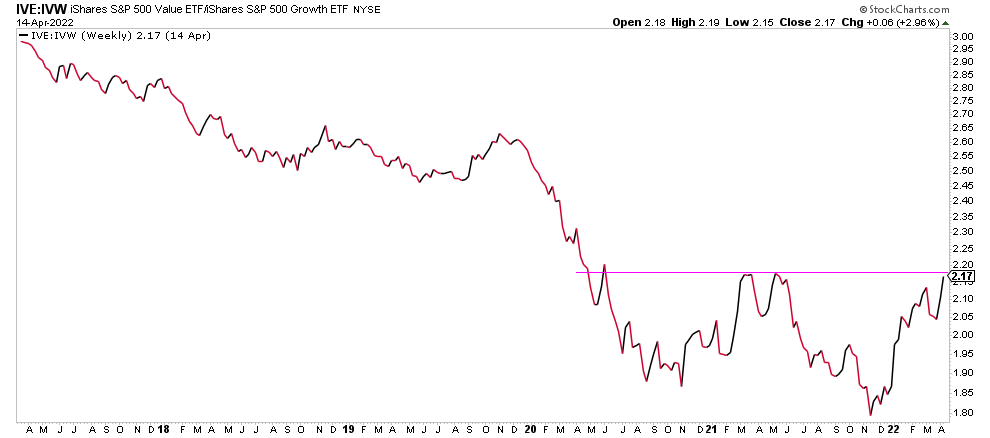
First, the ratio value vs. growth is setting a huge W reversal. One important note: ratio charts should be taken with caution. They are not as perfect as individual stock charts or sector charts. Still, the bullish reversal is really clear on this chart. The last hurdle to overcome, which might prove to be a big hurdle, to be seen, is the current level. Yes, in a way we are at a critical juncture right now.

value vs growth forecast

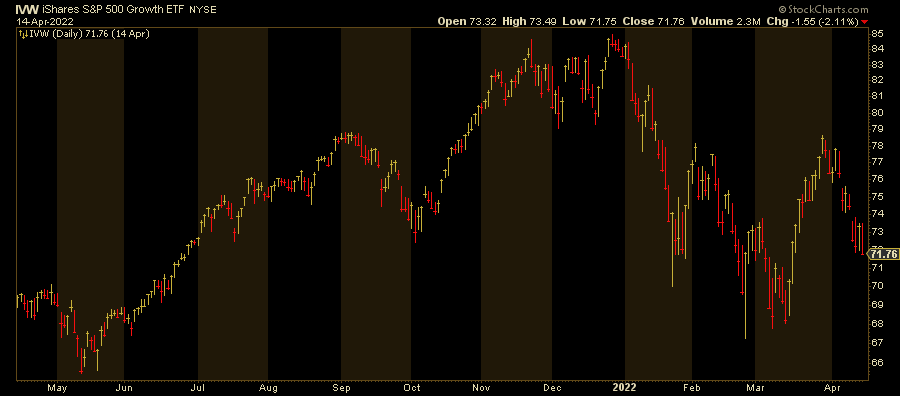
If we look at growth stocks, separately, on 12 months, we can see another critical juncture. This chart is setting up to become an inverted head & shoulders chart, which has a strongly bullish outcome. The alternative is a big breakdown. The Nasdaq has the exact same setup. Interestingly, next week will be resolution time. Yes, we are at a critical juncture right now.

growth 1 year

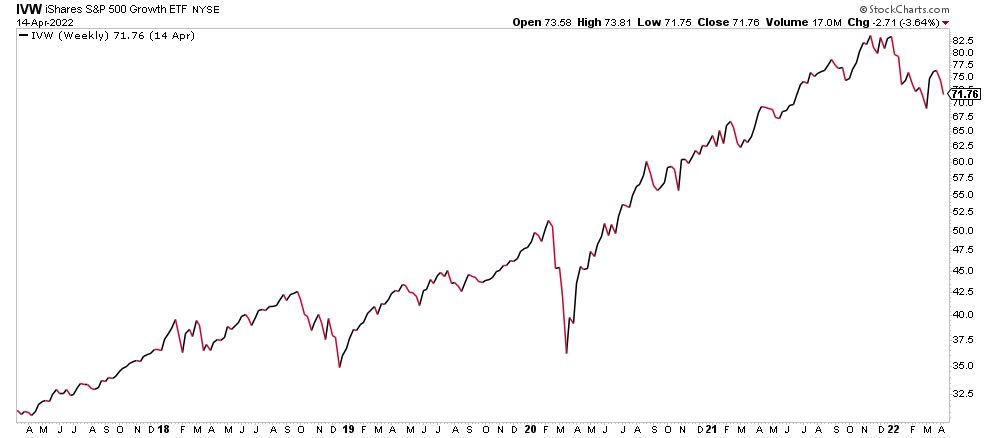
The 5 year chart of growth puts the potential head & shoulders vs major topping pattern into perspective. Whatever the outcome will be, it will be big, in either direction. We will get a first clue next week, and a final confirmation in max 3 weeks from now!

growth 5 years

There is more interesting insights.

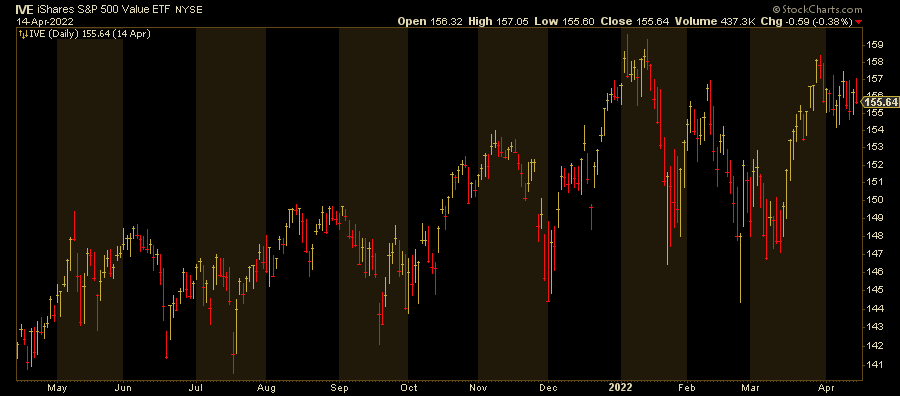
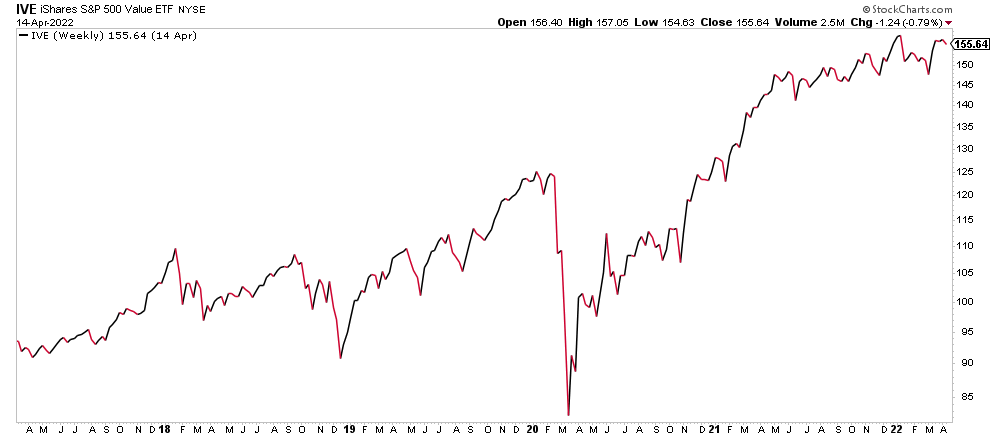
Value stocks are showing a head & shoulders pattern, one that started in October, so it’s wider than the one in growth stocks. Here as well: resolution time is here. This segment either moves higher and turns this bearish setup into a bullish breakout, or the recent highs qualify as a secondary top.

value 1 year

The 5 year chart has a topping pattern look. However, any move higher would qualify as a breakout and could be the start of a new leg higher.

value 5 years

The answer to the question value vs. growth will be solved shortly, it’s a matter of a few weeks maximum.

While growth looks horrible, a closer look suggests it could be a very bullish setup.

While value looks great, a closer look suggests it could be a bearish setup.

Ultimately, both segments may move higher.

Talking about resolution time and a critical juncture in markets, here is another interesting chart, this time a leading indicator for markets: bond yields. You can see how 10 year bond yields hit a secular trendline, on Friday, after a fast rise from 1.57 to 2.82.

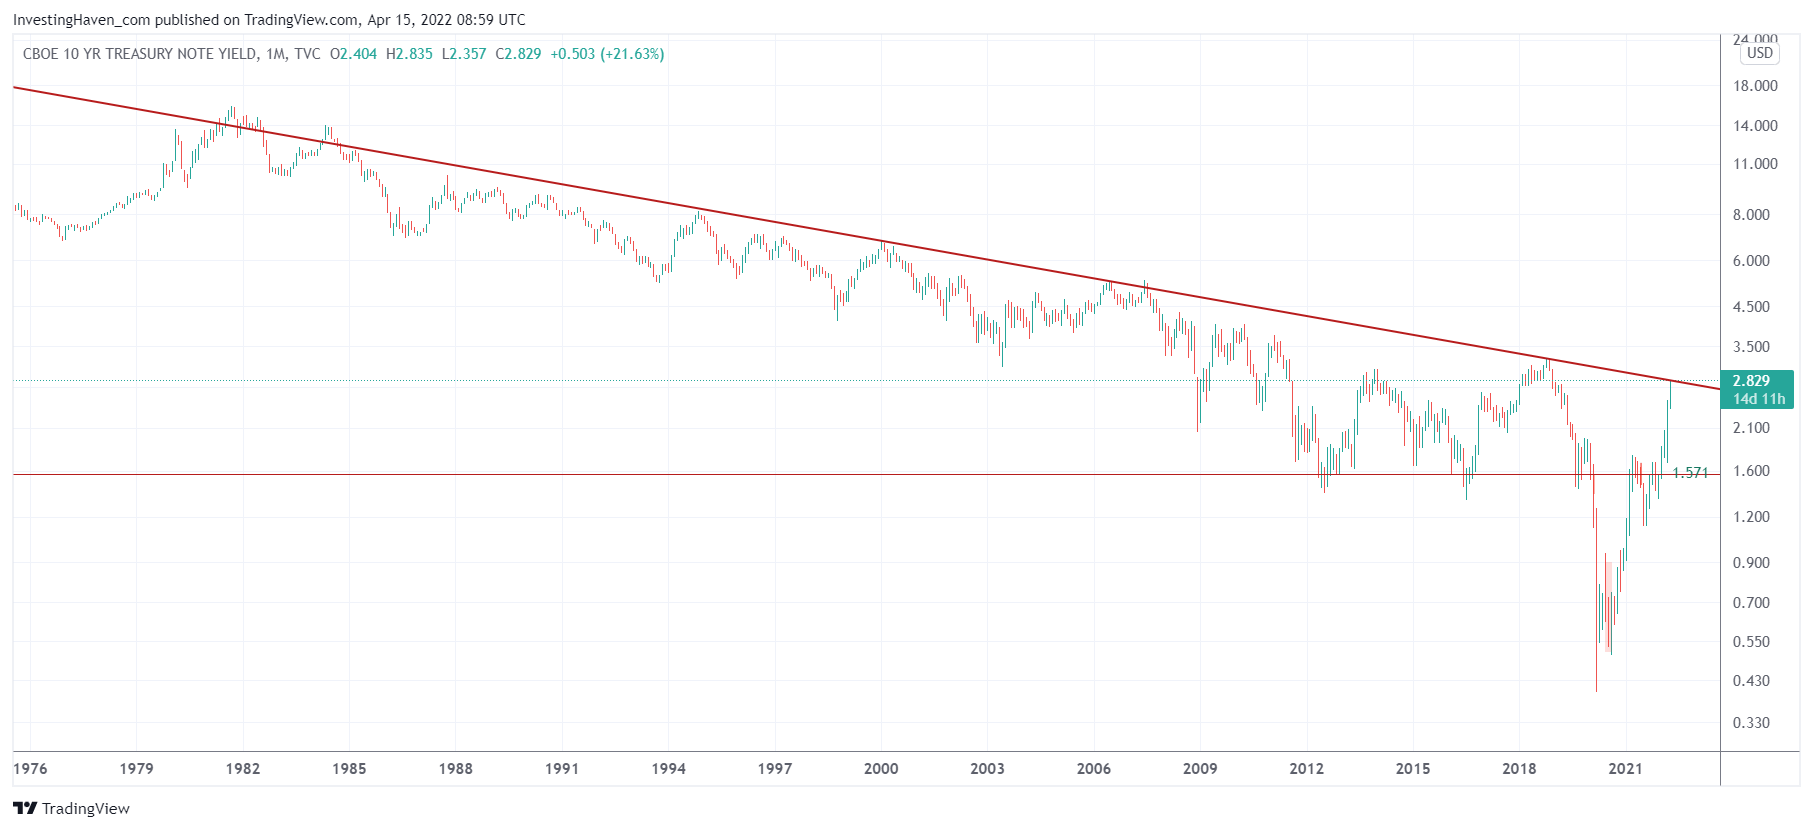
Any time bond yields rise fast they tend to create turmoil, this time it’s not any different.

What matters is where bond yields go from here. IF they find resistance here, it would be good for growth stocks.

Our best guess? Growth will recover, and some value segments will continue to do well. But the extreme moves which we got in both segments should turn into more ‘normal’ trends, whatever ‘normal’ means in this ‘new normal in markets‘.

10-YEAR ANNIVERSARY OFFER: InvestingHaven.com celebrates 10 years. Temporarily, you can enjoy a discount on our premium gold/silver and crypto reports. Or you can become a VIP member. Go to our anniversary deals >>
Receive our weekly newsletter.

premium service SP-500 premium service trade alerts premium service crypto teaser 

No related posts.

Taki T.

Taki T.

Taki is a chart analyst who is passionate about unlocking unique insights out the chart. While the vast majority of analysts remain focused on price analysis, Taki starts with timeline analysis and adds price analysis to this. In doing so, he developed a unique methodology to find opportunities in financial markets, across assets and markets.

Connect with InvestingHaven

Receive top notch forecasts for free.

*We hate spam as you do.

Site Navigation

  • RSS Feed
  • About us
  • Advertising
  • Sponsored Content Policy
  • Mission 2026
  • Sitemap
  • Privacy & Disclaimer
  • Terms of Service
  • Contact Us
investing haven logo

Precious metals market analysis including gold and silver price predictions. Crypto market analysis including highly accurate BTC ETH SOL XRP forecasts.

Copyright © 2025 InvestingHaven

Login to your account below

Forgotten Password?

Fill the forms bellow to register

All fields are required. Log In

Retrieve your password

Please enter your username or email address to reset your password.

Log In

Receive top notch forecasts for free.

*We hate spam as you do.

No Result
View All Result
  • News
  • 2025 Forecasts
    • 10 market predictions
    • Dow Jones forecast 2025
    • S&P 500 forecast 2025
    • Nasdaq prediction 2025
    • Best crypto to buy now
    • Which crypto will explode
    • Best altcoins to buy
    • 15 crypto forecasts 2025
    • Which precious metal to buy
  • Silver articles
    • Silver prediction 2025 – 2030
    • Will silver exceed $30?
    • When will silver hit $50?
    • Can silver hit $100?
    • Silver shortage
    • 50-year silver chart
    • Silver bullish reversal
    • Silver seasonality charts
    • How to invest in silver
  • Gold
    • Gold prediction 2025 – 2030
    • Will gold set new ATH?
    • Will gold hit $3,000?
    • Can gold hit $10,000?
    • Gold chart 10 years
    • Gold chart 50 years
    • Gold chart 100 years
    • Gold silver ratio
    • Gold seasonality charts
  • Commodities
    • Sugar forecasts
    • Coffee forecasts
    • Nickel forecasts
    • Lithium investing
  • Crypto news
  • Crypto forecasts
    • BTC prediction 2025 – 2030
    • ETH prediction 2025 – 2030
    • SOL prediction 2025 – 2030
    • XRP prediction 2025 – 2030
    • XLM prediction 2025 – 2030
    • BNB prediction 2025 – 2030
    • ADA prediction 2025 – 2030
    • AVAX prediction 2025 – 2030
    • KAS prediction 2025 – 2030
    • NEAR prediction 2025 – 2030
    • BCH prediction 2025 – 2030
    • LINK prediction 2025 – 2030
    • DOT prediction 2025 – 2030
    • SUI prediction 2025 – 2030
    • ICP prediction 2025 – 2030
    • LTC prediction 2025 – 2026
    • STX prediction 2025 – 2030
    • DOGE prediction 2025 – 2030
    • SHIB prediction 2025 – 2030
    • PEPE prediction 2025 – 2030
    • FLOKI prediction 2025 – 2030
    • WIF prediction 2025 – 2030
    • ONDO prediction 2025 – 2030
  • Premium Crypto Alerts
  • Premium services

Copyright © 2025 InvestingHaven