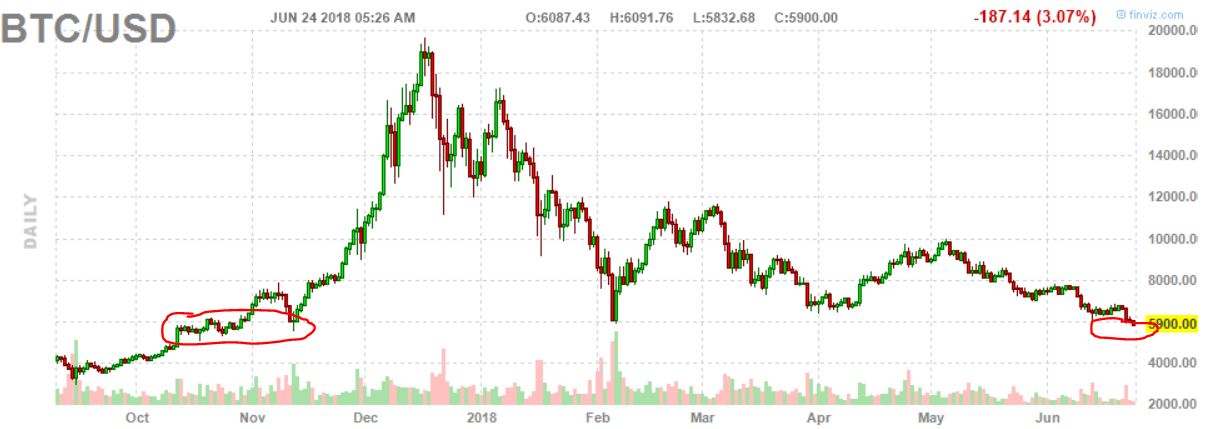
Last night, the price of Bitcoin (BTC) broke below the important $6k level which we identified as a crucial level. What now?
Last week, we wrote How To Read Bitcoin’s Price Chart For 2018. In it, the key point we made is that the acceleration in Bitcoin’s price started last October/November, right at the $6k level. As with any parabolic rise there is lots of ‘weak hands’ entering the market, while ‘strong hands’ tend to enter before any parabolic rise.
Likewise, for Bitcoin, ‘strong hands’ entered the market below $6k.
In other words, although technically not a 100% accurate statement, most buyers since October last year have sold. Again, it’s meant to paint a picture as opposed to being entirely correct.
Now that Bitcoin’s price has moved below $6000, what now?
First, Bitcoin’s decline is decelerating. We are moving to a flat situation as opposed to an extremely volatile price pattern. It implies that the downside becomes limited. Check out bitcoin code de for more.
Second, while we refered to the ‘$6k level’ it was not meant to be exactly and only $6,000. As seen on the daily chart below the ‘$6k level’ represents a range between $5700 and $6100 to be very precise. In other words, we are right at an area which is crucial, not exactly a precise price point. There is some wiggle room at current levels, and there is no reason to panick at this point in time, on the contrary.
The question should be asked: is this a formidable buy opportunity as opposed to a reason to panick?
We strongly believe the answer is YES, the reason being that the longer timeframe points out that we are not very far away from a bottom. Where do we see this? On the longer term timeframe. As always, once the daily timeframe is not revealing more info about long term trends and forces at play in the form of clear patterns, it is mandatory to zoom out. The challenge with Bitcoin’s price chart is that zooming out paints a wrong picture given the scale of the axes. That’s why a logarithmic chart is a must, certainly on the longer term timeframe(s).
The challenge with this is that hardly any site provides a decent logarithmic long term chart of Bitcoin.
We have identified 2 clear price points on Bitcoin’s long term log chart which reveal where Bitcoin is likely to stop falling. They are not that far away from current levels, but many investors will get so disappointed because they cannot stand the decline and want to recovery to go faster (which, likely, it may not go as fast as expeccted). Consequently, hey will sell between now and then. That is the effect of ‘weak hands’ selling near a bottom. These detailed and actionable insights are reserved for our premium blockchain investing subscribers, and they will be alerted today with all details and answers to the ‘what now’ question. Interested to know more, subscribe here >>


