Investing Haven
No Result
View All Result
Gold Silver Investing >>
CRYPTO INVESTING >>
  • 2025 Forecasts
    • 10 market predictions
    • Dow Jones forecast
    • S&P 500 forecast 2025
    • Nasdaq prediction 2025
    • Best altcoins to buy
    • Best crypto to buy now
    • Which crypto will explode
    • 15 crypto forecasts 2025
    • Which precious metal to buy
  • Silver
    • Silver prediction 2025 – 2030
    • Will silver exceed $30?
    • When will silver hit $50?
    • Can silver hit $100?
    • Silver shortage
    • 50-year silver chart
    • Silver bullish reversal
    • Silver seasonality charts
    • How to invest in silver
  • Gold
    • Gold prediction 2025 – 2030
    • Will gold set new ATH?
    • Will gold hit $3,000?
    • Can gold hit $10,000?
    • Gold chart 10 years
    • Gold chart 50 years
    • Gold chart 100 years
    • Gold silver ratio
    • Gold seasonality charts
  • Commodities
    • Coffee forecasts
    • Sugar forecasts
    • Nickel forecasts
    • Lithium investing
  • Crypto forecasts
    • BTC prediction 2025 – 2030
    • ETH prediction 2025 – 2030
    • SOL prediction 2025 – 2030
    • XRP prediction 2025 – 2030
    • XLM prediction 2025 – 2030
    • BNB prediction 2025 – 2030
    • ADA prediction 2025 – 2030
    • AVAX prediction 2025 – 2030
    • KAS prediction 2025 – 2030
    • NEAR prediction 2025 – 2030
    • BCH prediction 2025 – 2030
    • LINK prediction 2025 – 2030
    • DOT prediction 2025 – 2030
    • SUI prediction 2025 – 2030
    • ICP prediction 2025 – 2030
    • LTC prediction 2025 – 2026
    • STX prediction 2025 – 2030
    • DOGE prediction 2025 – 2030
    • SHIB prediction 2025 – 2030
    • PEPE prediction 2025 – 2030
    • FLOKI prediction 2025 – 2030
    • WIF prediction 2025 – 2030
    • ONDO prediction 2025 – 2030
  • News
    • Crypto news
    • Commodities
  • Login
Investing Haven
No Result
View All Result

Home » Reading markets » How To Read Bitcoin’s Price Chart For 2018

How To Read Bitcoin’s Price Chart For 2018

Taki Tsaklanos by Taki Tsaklanos
February 1, 2019
in Reading markets
bitcoin cryptocurrency
2.2k
VIEWS
Share on FacebookShare on Twitter

There is a lot of emotion among investors when it comes to cryptocurrencies in general and Bitcoin (BTC) in particular. The really important thing in this type of environment is to stay cool, only focus on the facts that really matter, avoid mainstream news. Therefore, a  thorough understanding of the price chart of Bitcoin is imperative. We share lots of details and insights with premium cryptocurrency subscribers, but this article is a ‘sneak peek’ which we also share in the public domain: how to read the Bitcoin price chart for guidance in the crypto market in 2018 and beyond?

People tend to ask how it is possible to do a Price Of Bitcoin Forecast of 50,000 USD if Bitcoin continues falling. Same question applies to this other major cryptocurrency: is our Stellar Lumens Price Forecast of 4 USD still actual?

That’s very simple, our forecast is a longer term forecast based on the insight that cryptocurrencies did not reach their final top as of yet. The simplest way to know is to look around and compare with the dotcom and housing bubbles: back then, literally everyone was so deep into tech stocks and debt (housing in  the US and other consumer debt elsewhere) while today hardly anyone owns cryptocurrencies set aside uses them. On the contrary, after the recent crash, almost everyone anonymously wants to avoid cryptocurrencies, among the general public. There is no major top yet because of this primary reason, and many other reasons.

This is how to read Bitcoin’s 2018 price chart

It is easy to get caught in the news feeds, and really get lost in what to make out of the current price action in Bitcoin. InvestingHaven’s research team is known to simplify things, and start with the chart. It’s the opposite way to look at markets and investing, but one that has appeared to be extremely effective if applied correctly.

Bitcoin’s price chart for 2018 is an easy read, though we have not seen this way of reading Bitcoin’s chart anywhere before.

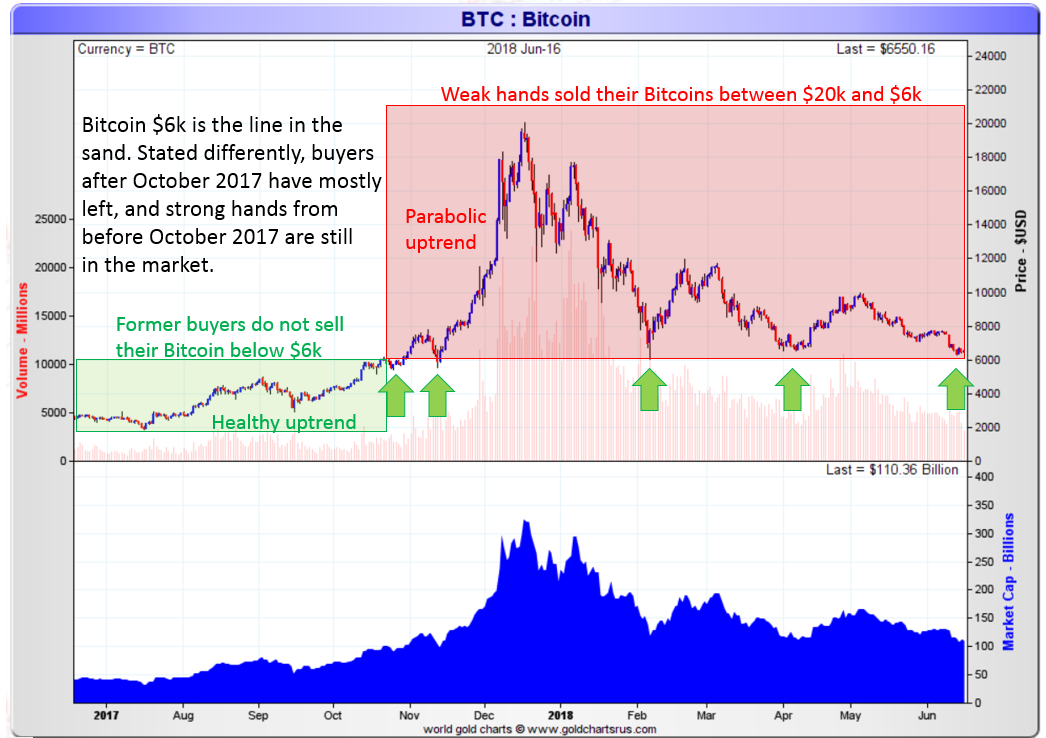
Essentially, the $6k price level is the ‘line in the sand’. No surprise because it got tested 5 times in 8 months, it’s the only price point that got tested so many times. So it must have a special meaning. No coincidence that this price level is the one that got tested right before the parabolic rise of November and December started!

What exactly does this mean? How to translate this into actionable insights?

The simplest way to interpret this: all weak hands which entered the cryptocurrency market, especially Bitcoin, since it started rising at a parabolic and, therefore, non sustainable pace, since October 2017, are leaving the arena.

In other words, by the natural forces of supply and demand the market goes back to October 2017 when there was a healthy uptrend to set a price equilibrium. Weak hands are the ones that got in between $6k and $20k, and most of them sold in the meantime, unfortunately for them, probably feared by toxic news and not being able to handle red figures in their account.

This is of course a black-and-white way to summarize a situation. The reality is a bit more complicated, and not exactly the same we phrased it.

Still, we get very close to the essence of what’s going on, and why Bitcoin has fallen for the 3d time in 5 months to this magic $6k level, which, again, seems to be holding pretty strong (at least, so far).

Eight months of gains got lost, we go back 8 months in time, 8 months of buyers have sold … all different ways to express what is going on in the Bitcoin market.

InvestingHaven’s research time reiterates that this is a healthy pullback. If $6k Bitcoin continues to hold strong, we will become super bullish, and it will be the ultimate proof that we are correctly reading the Bitcoin price chart for 2018 and beyond.

Here you can have more detailed and actionable insights on cryptocurrencies and blockchain stocks.

read bitcoin price chart 2018

10-YEAR ANNIVERSARY OFFER: InvestingHaven.com celebrates 10 years. Temporarily, you can enjoy a discount on our premium gold/silver and crypto reports. Or you can become a VIP member. Go to our anniversary deals >>
Receive our weekly newsletter.

premium service SP-500 premium service trade alerts premium service crypto teaser 

Related posts:

  1. 15 Cryptocurrency Forecasts For 2025
Tags: 2018 ForecastsBitcoin
Taki Tsaklanos

Taki Tsaklanos

Taki has +15 years of experience in global markets. He is passionate about forecasting markets - he calls it THE ART OF FORECASTING. His analysis methodology is unique and effective, yet easy to understand; it is based on chart analysis combined with intermarket / fundamental / sentiment analysis. His work appeared on major financial outlets like FinancialSense, MarketWatch,Twitter: twitter.com/investinghaven

Leave a Reply Cancel reply

Your email address will not be published. Required fields are marked *

Connect with InvestingHaven

Receive top notch forecasts for free.

*We hate spam as you do.

Site Navigation

  • RSS Feed
  • About us
  • Advertising
  • Sponsored Content Policy
  • Mission 2026
  • Sitemap
  • Privacy & Disclaimer
  • Terms of Service
  • Contact Us
investing haven logo

Precious metals market analysis including gold and silver price predictions. Crypto market analysis including highly accurate BTC ETH SOL XRP forecasts.

Copyright © 2025 InvestingHaven

Login to your account below

Forgotten Password?

Fill the forms bellow to register

All fields are required. Log In

Retrieve your password

Please enter your username or email address to reset your password.

Log In

Receive top notch forecasts for free.

*We hate spam as you do.

No Result
View All Result
  • News
  • 2025 Forecasts
    • 10 market predictions
    • Dow Jones forecast 2025
    • S&P 500 forecast 2025
    • Nasdaq prediction 2025
    • Best crypto to buy now
    • Which crypto will explode
    • Best altcoins to buy
    • 15 crypto forecasts 2025
    • Which precious metal to buy
  • Silver articles
    • Silver prediction 2025 – 2030
    • Will silver exceed $30?
    • When will silver hit $50?
    • Can silver hit $100?
    • Silver shortage
    • 50-year silver chart
    • Silver bullish reversal
    • Silver seasonality charts
    • How to invest in silver
  • Gold
    • Gold prediction 2025 – 2030
    • Will gold set new ATH?
    • Will gold hit $3,000?
    • Can gold hit $10,000?
    • Gold chart 10 years
    • Gold chart 50 years
    • Gold chart 100 years
    • Gold silver ratio
    • Gold seasonality charts
  • Commodities
    • Sugar forecasts
    • Coffee forecasts
    • Nickel forecasts
    • Lithium investing
  • Crypto news
  • Crypto forecasts
    • BTC prediction 2025 – 2030
    • ETH prediction 2025 – 2030
    • SOL prediction 2025 – 2030
    • XRP prediction 2025 – 2030
    • XLM prediction 2025 – 2030
    • BNB prediction 2025 – 2030
    • ADA prediction 2025 – 2030
    • AVAX prediction 2025 – 2030
    • KAS prediction 2025 – 2030
    • NEAR prediction 2025 – 2030
    • BCH prediction 2025 – 2030
    • LINK prediction 2025 – 2030
    • DOT prediction 2025 – 2030
    • SUI prediction 2025 – 2030
    • ICP prediction 2025 – 2030
    • LTC prediction 2025 – 2026
    • STX prediction 2025 – 2030
    • DOGE prediction 2025 – 2030
    • SHIB prediction 2025 – 2030
    • PEPE prediction 2025 – 2030
    • FLOKI prediction 2025 – 2030
    • WIF prediction 2025 – 2030
    • ONDO prediction 2025 – 2030
  • Premium Crypto Alerts
  • Premium services

Copyright © 2025 InvestingHaven