As per Tsaklanos his 1/99 Investing Principles there is only a few leading indicators that matter. Similarly there is only a few charts that set the direction for global market trends. In our Momentum Investing methodology we track global market trends with less than 10 leading indicators, that’s it. If we include our extended list of charts we come to max 25 charts. Two of those 25 charts have a very important message for stock market investors, both the bulls and the bears.
Note that our forecasting methodology uses the same charts. Yes we derived a bullish outcome for stock markets in 2020, and also a bullish gold forecast. This is not conflicting per se, and the case we always reference to make this point is the 2004-2007 mega uptrend in gold.
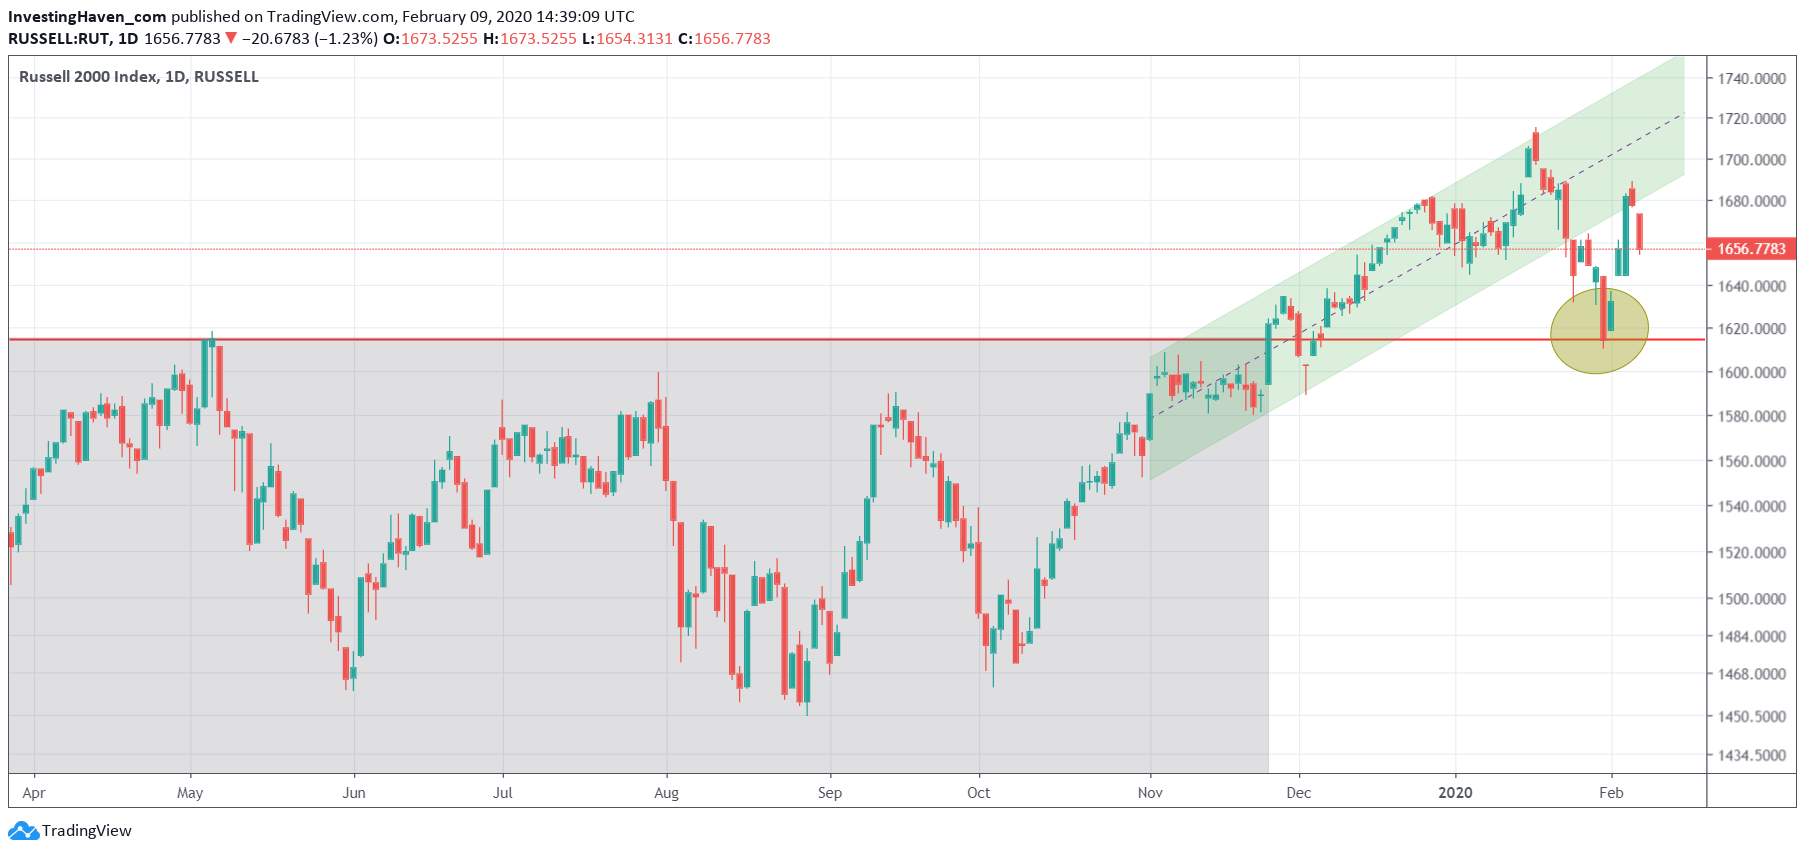
That said the first chart we want to highlight is our favorite risk indicator for stock markets: the Russell 2000 index. Note we look at this index as an indicator.
Watch what happened in the last week of January on this chart: a backtest of the secular breakout point. For now it looks like the ‘line in the sand’ level 1615 points did hold. We need more indicators to turn bullish. On the other hand a decline below this 1615 level will create serious damage.

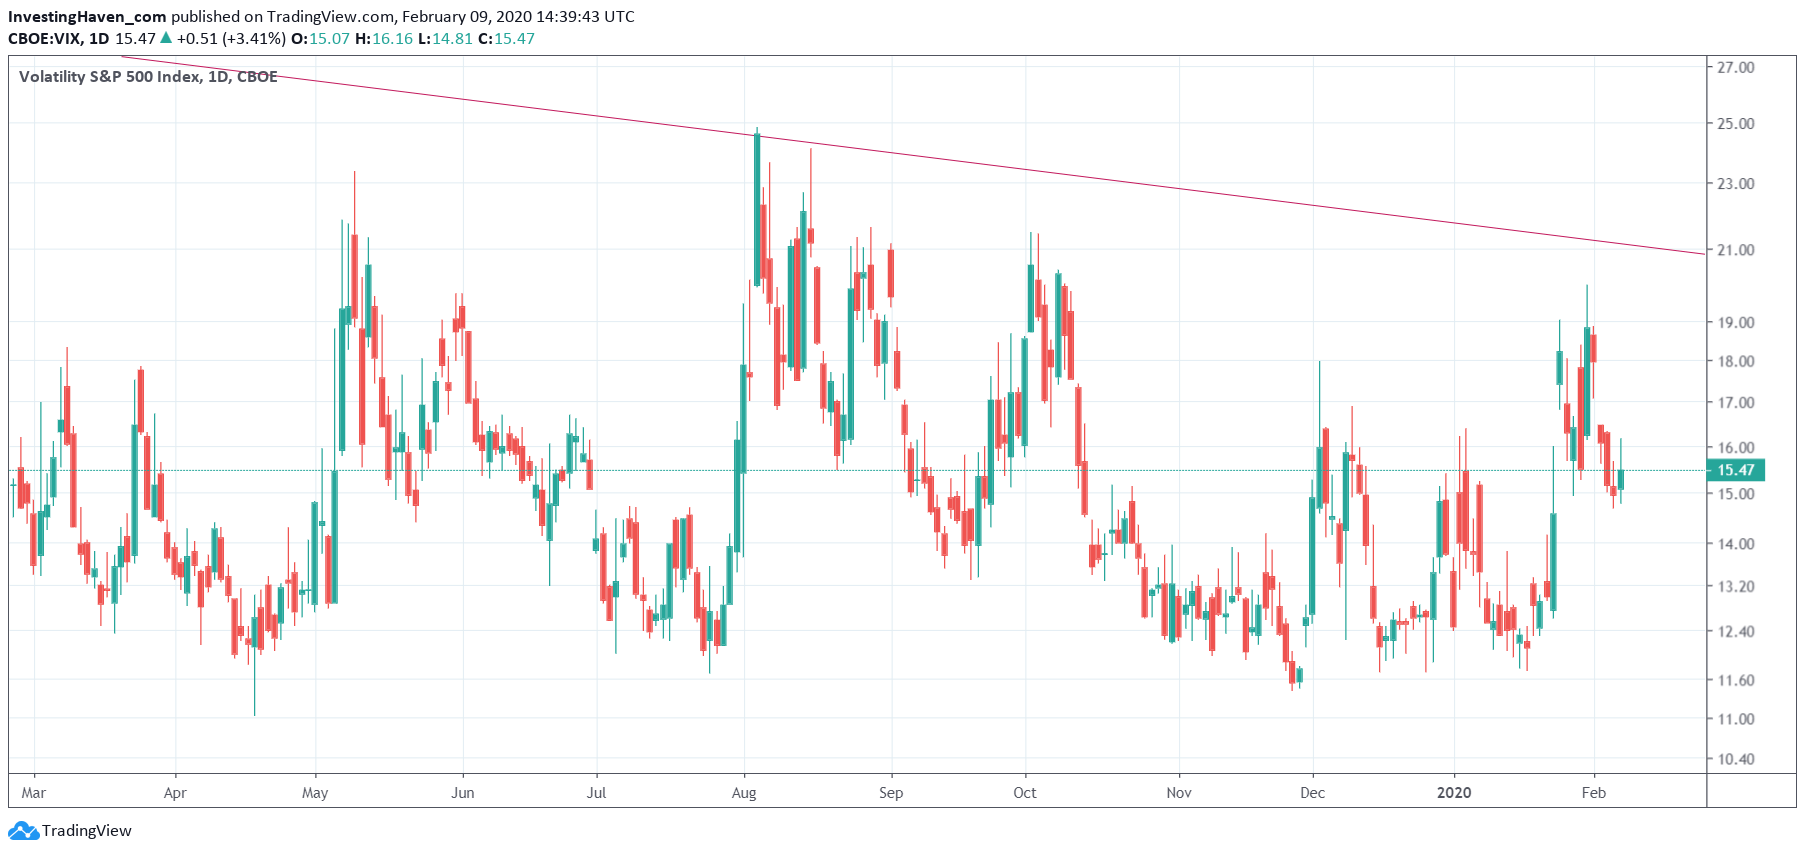
The second must-see chart is the VIX index.
Look how the rise to the upper resistance line which represents resistance of a 4 year trend.
Any break above this resistance level will result in heavy sell-off, regardless whether it will be short lived or not.
In the last few days the VIX index retraced but it still trades above the 15 level. This indicator says to be cautious in the near term until all leading indicators, including the one above, show signs of easing.


