
2019 is a pivotal year for global stock markets. We have shown this with 12 different market and economic indicators in our stock market crash 2019. In this article we come to the same conclusion by looking at 20 charts of international stock markets. In other words, we see that both the international stock markets as well as the leading indicators paint a similar picture, one in which global markets are at a major decision point at the start of 2019. These findings are in line with our 15 leading indicators and dominant market trends although we use different assets for both assessments.
One might argue that there is not sufficient value in looking at international stock markets as they are all part of the same asset class. In other words if the trend in stocks is higher in 2019 then likely all international stock markets will go up in 2019.
That might be true to some extent. We believe this is partially true because there are leading markets (like the U.S.) which make them more important in setting the direction versus some others.
However, the more important point about this exercise is to identify the patterns in which most international stock markets move. That’s where the value lies in analyzing multiple markets, especially the 20 charts of international stock markets in this article.
20 Charts Of International Stock Markets
Note that we attribute more value in analyzing the chart patterns than news on global market. That’s because news tends to be a lagging indicator while patterns on charts are much more leading (in nature). Moreover, large financial sites like the WSJ may have a global market chart section which is great but it’s pretty tough to identify patterns on these charts.
What we do in this article is add value by identifying, and manually drawing, the patterns that we believe are dominant on monthly charts of 20 international stock markets.
The monthly timeframe is chosen as it is the one that, in general, tends to show dominant trends.
The conclusion of these 20 international stock market charts is that most of them are trading at or near critical multi-year trendlines or support lines. This suggests that global stock markets, as an asset class, are at a pivotal point. It also suggests that we need to be open for any outcome, both bullish or bearish, and how stock markets behave around current price levels will be decisive for 2019.
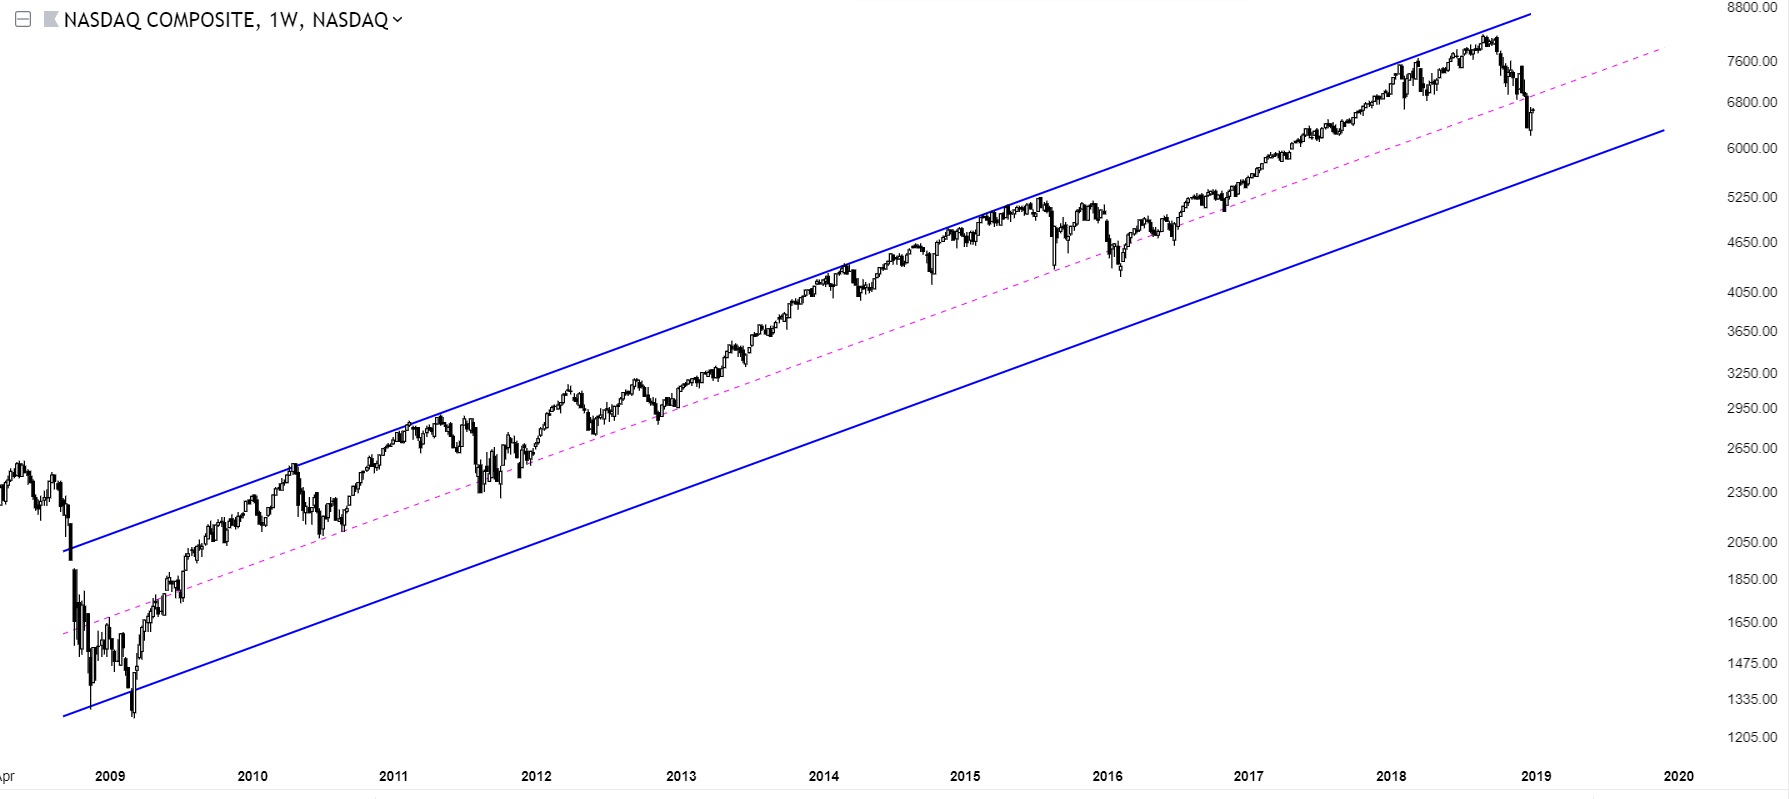
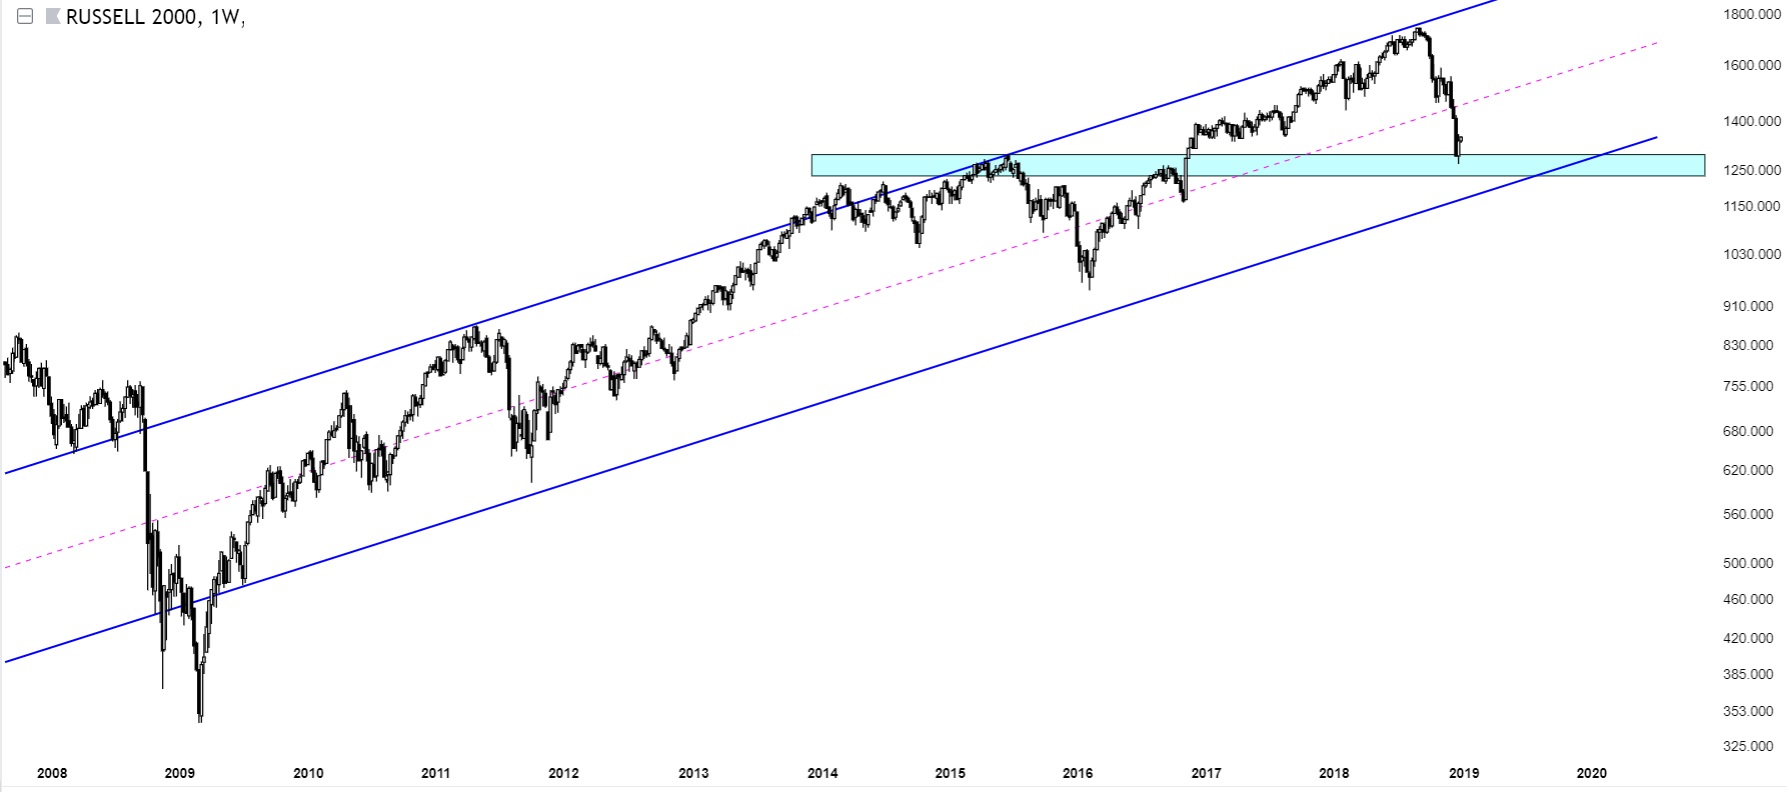
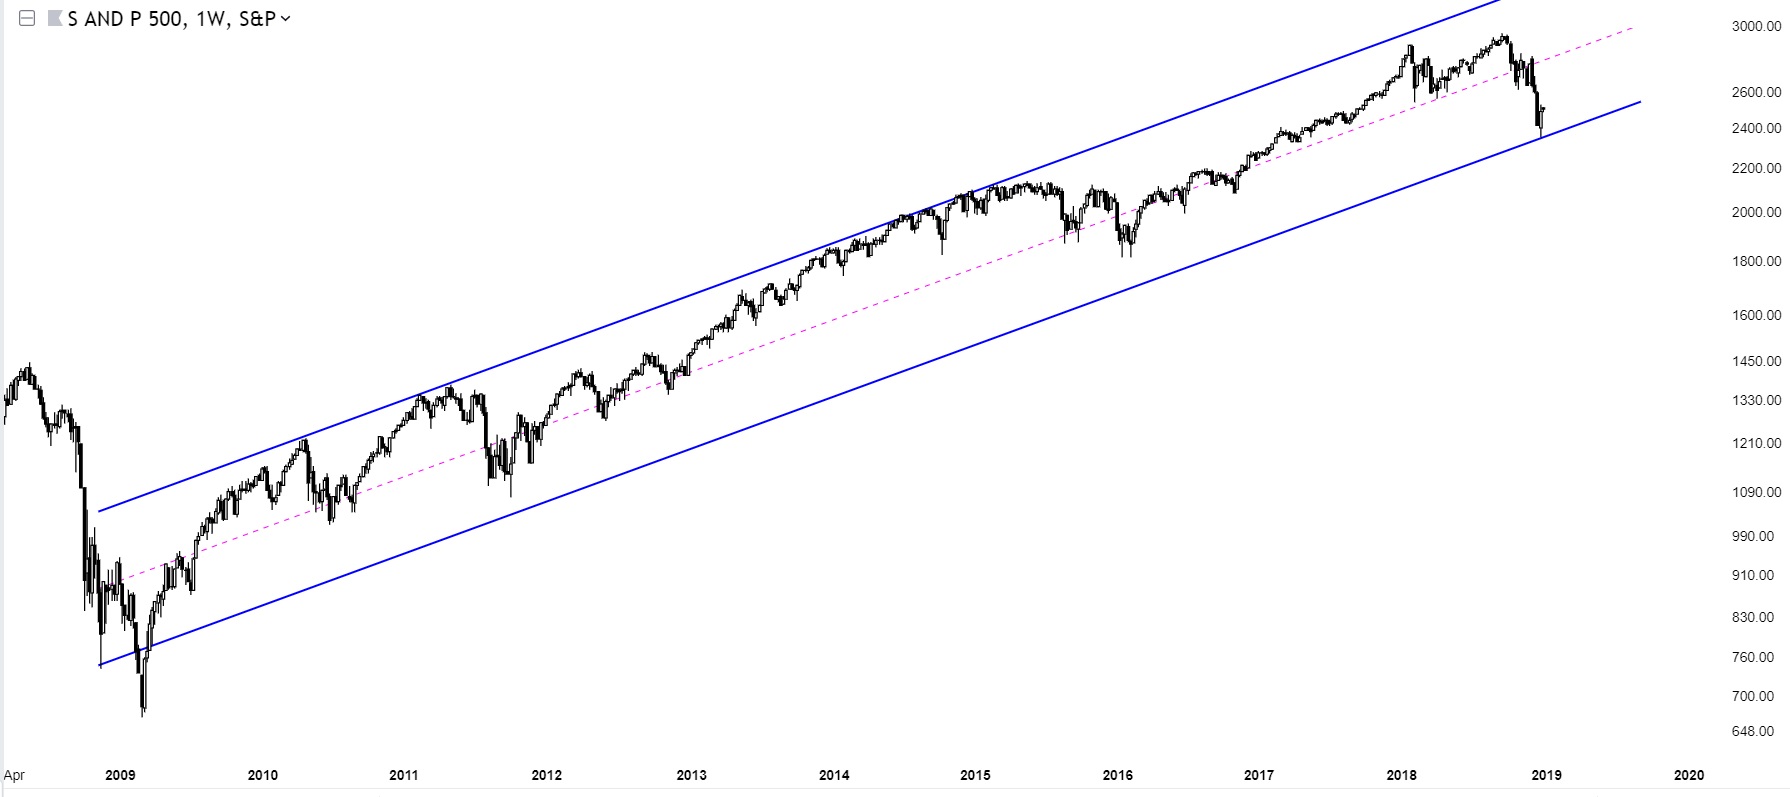
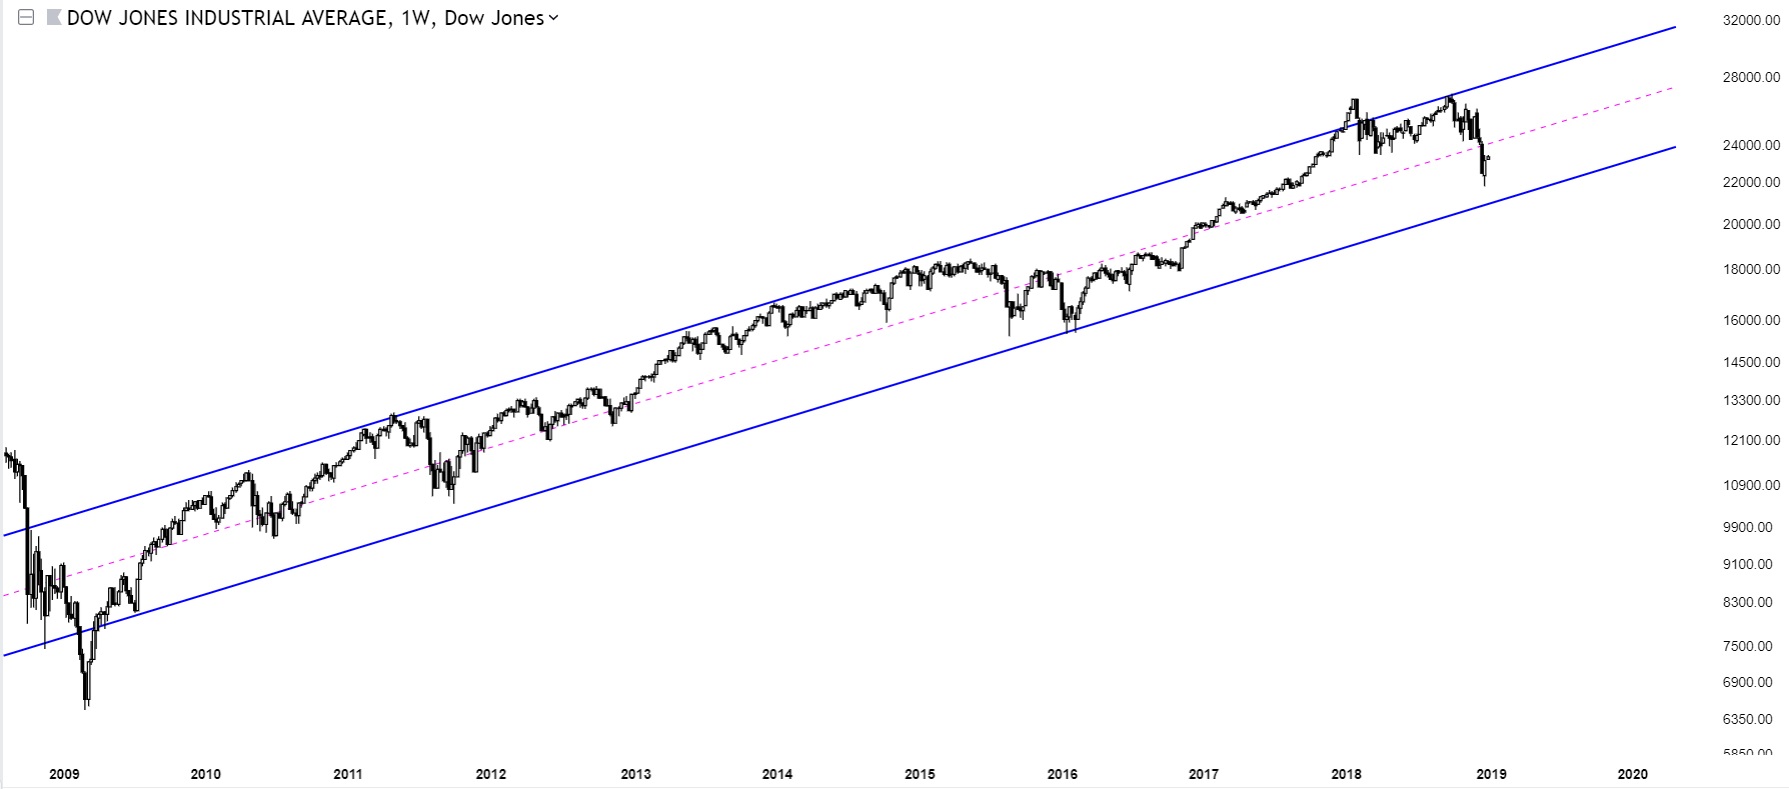
Charts Of International Stock Markets In 2019: United States
The first series of charts are from U.S. stock indices.
It seems that the Nasdaq Composite, Russell 2000 and the Dow Jones Index could still drift lower as there is not lots of support around current levels. The one common theme for all U.S. stock indices is that they should not breach support, and that the downside until support is breached is limited.
The Nasdaq Composite chart has some more downside potential until the 5800-5900 area before it becomes really bearish for 2019.
The Russell 2000 trades at horizontal support, though there is some room until channel support. We want to see horizontal support being respected, ideally, as this would send a strong signal. Note that we came to this conclusion as well in U.S. Stocks: Is The Decline Over?
The S&P 500 already tested its lowest support recently. So far so good, as the decline came to an halt exactly at channel support.
The Dow Jones Industrial index has a somehow similar setup as the Nasdaq.
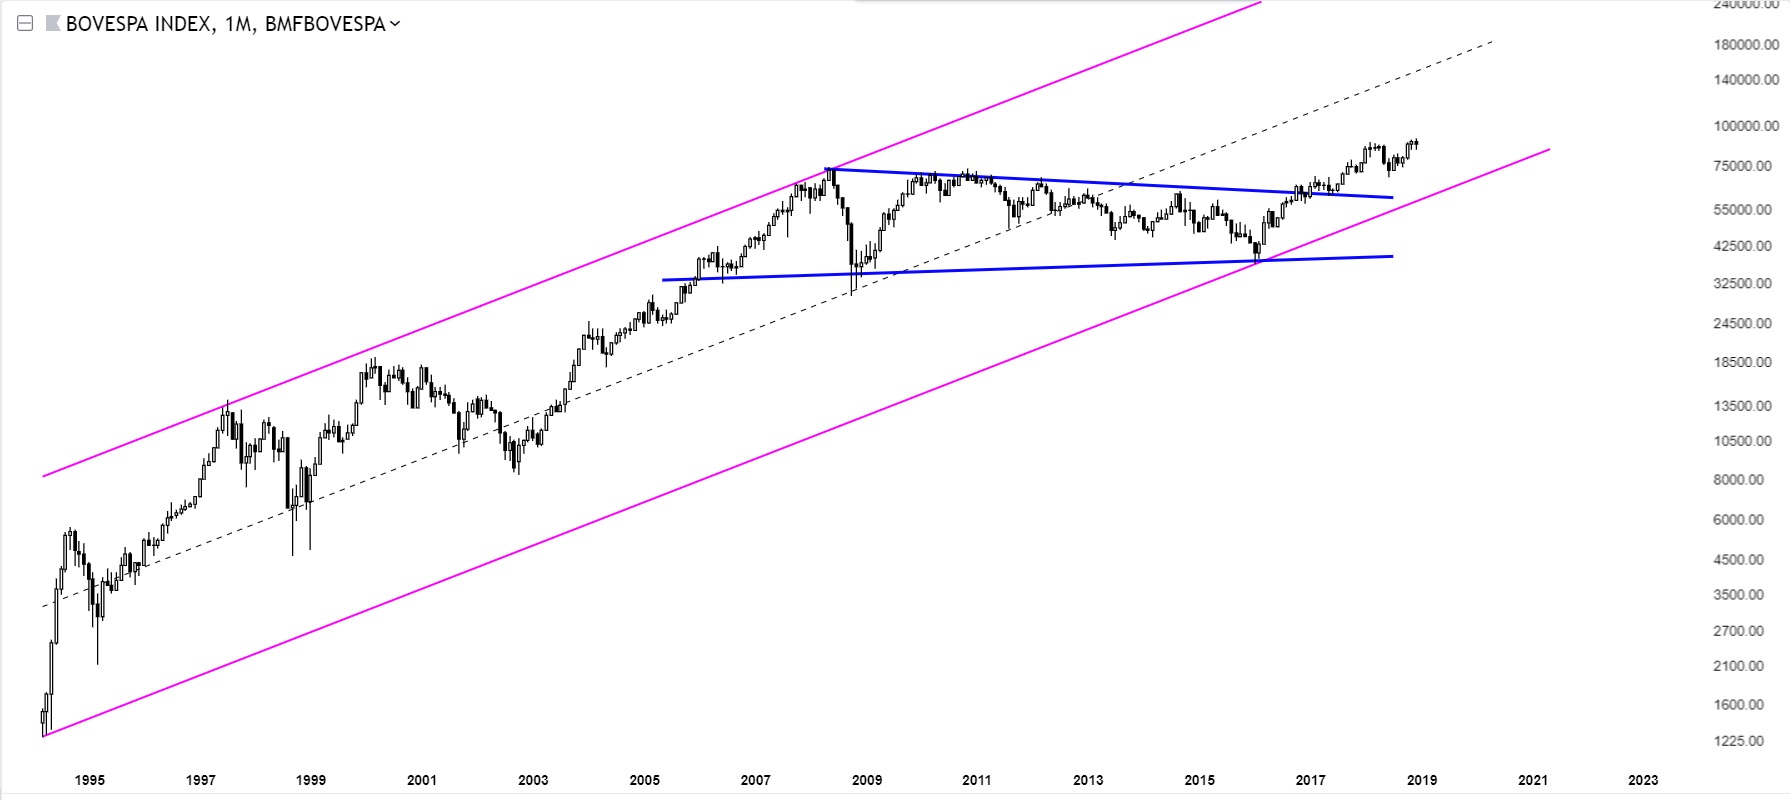
Charts Of International Stock Markets In 2019: Latin America
In Latin American we see the only stock index in international markets that is really impressive. The Bovespa index in Brazil is now trading at all-time highs, and certainly qualifies as the exception among the 20 charts of international stock markets that we have analyzed.
Charts Of International Stock Markets In 2019: Europe
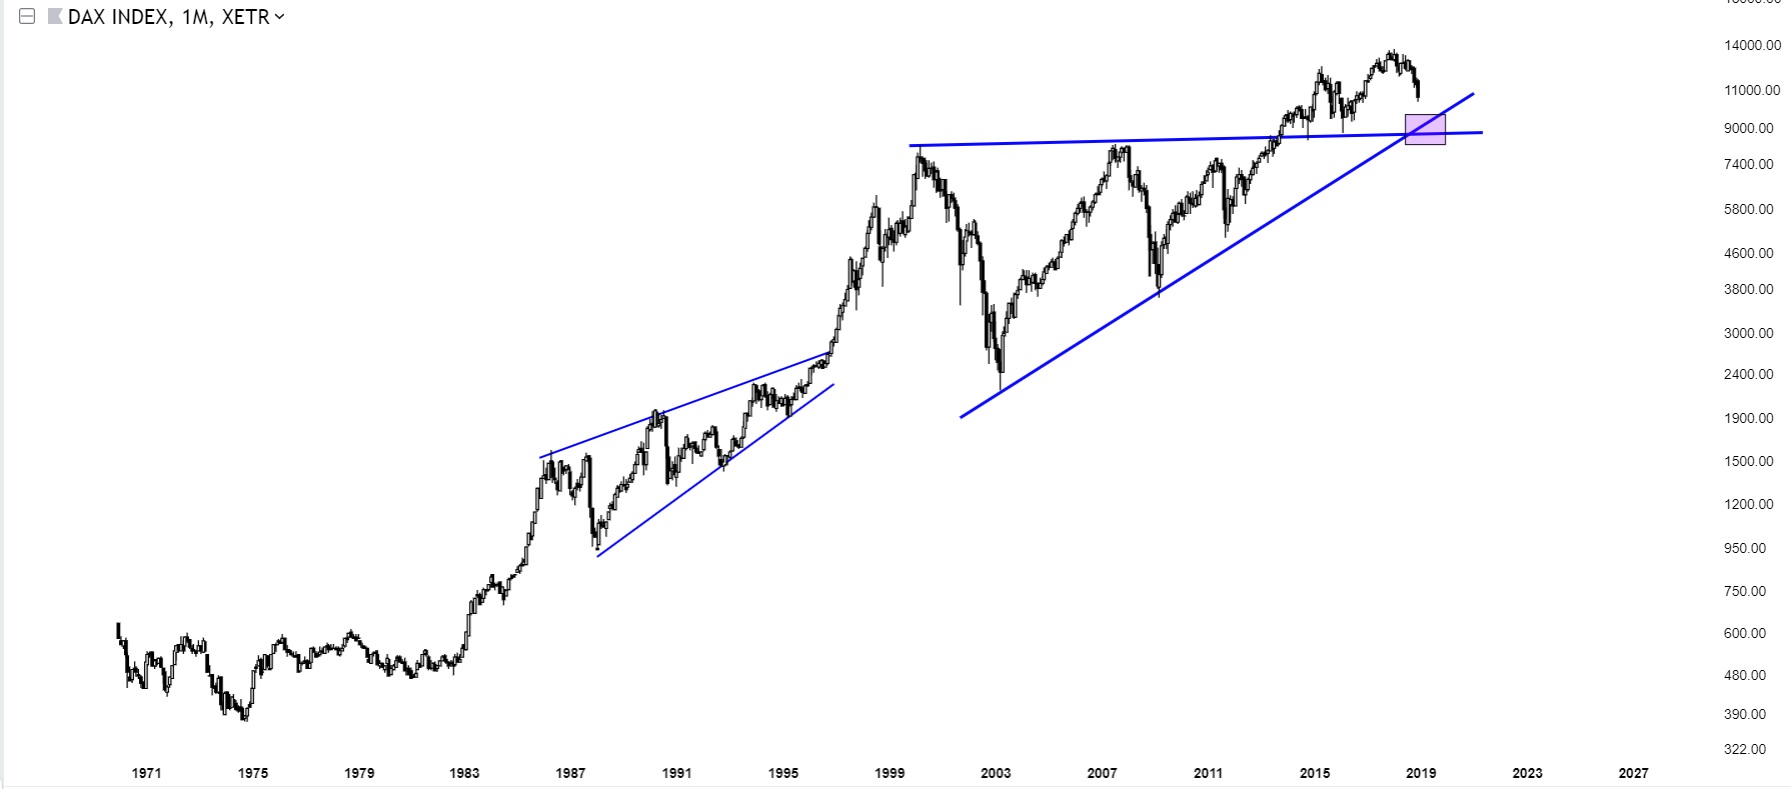
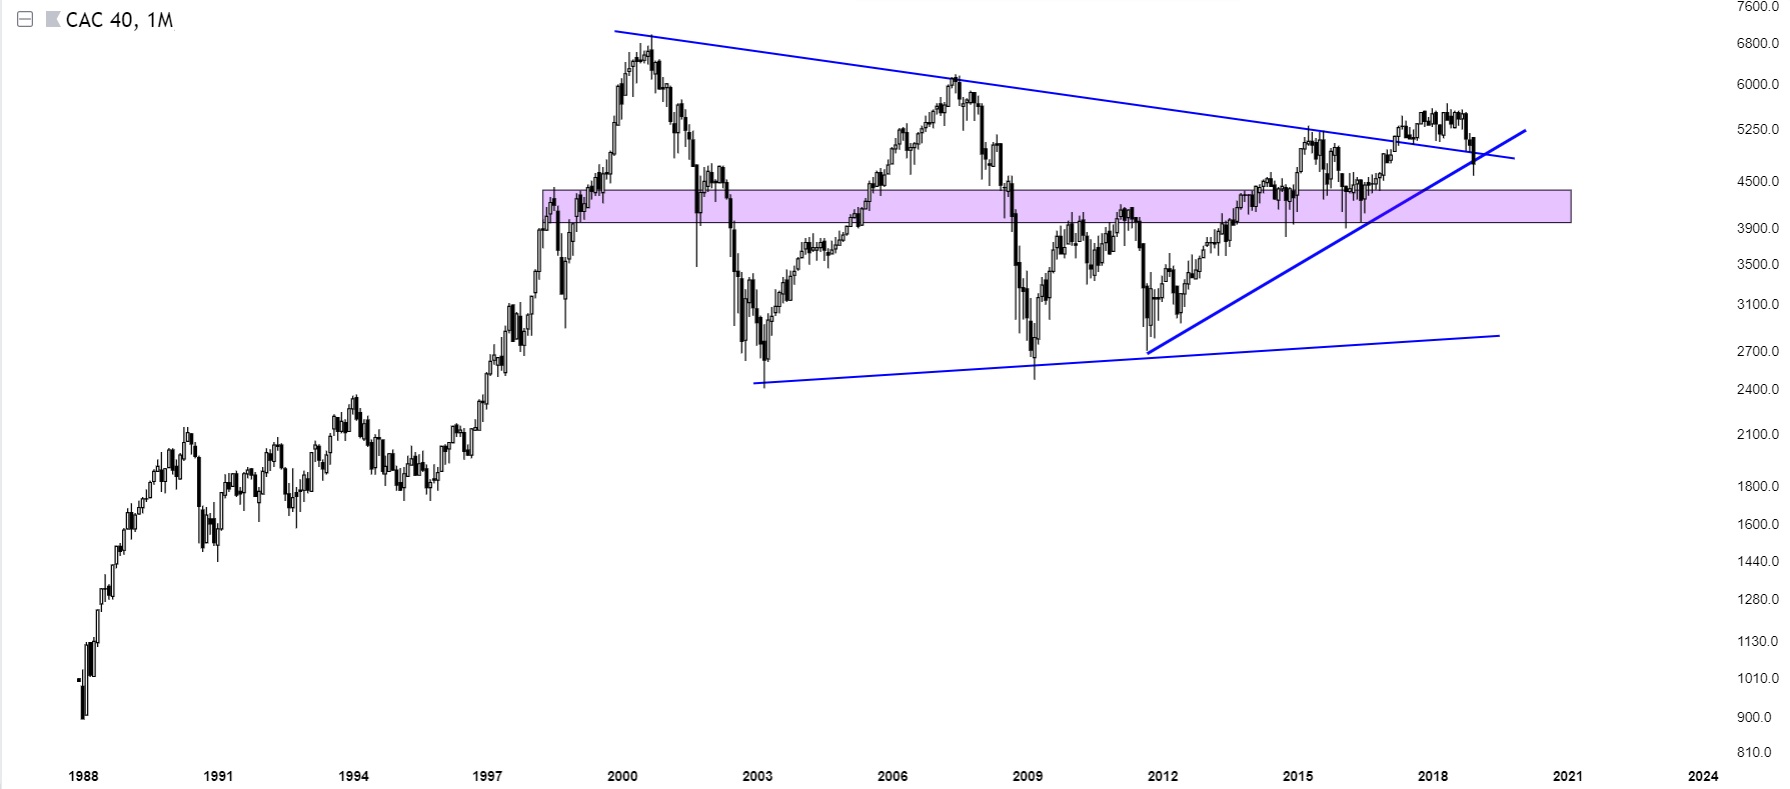
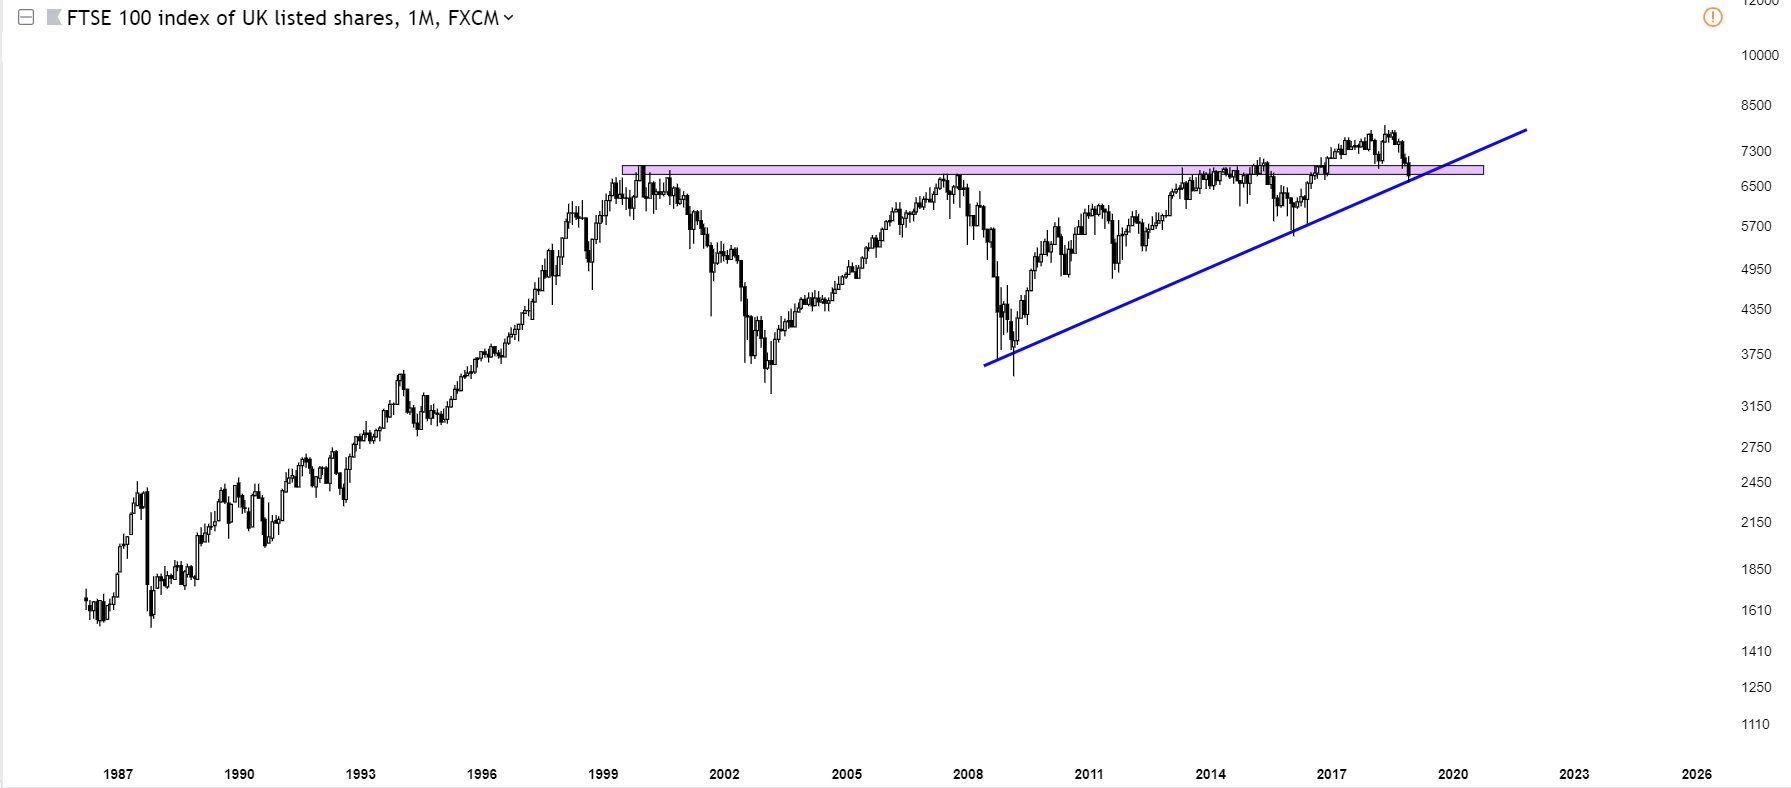
The European indices did not perform that well, as some markets have still some downside but others are already at a critical decision point.
In Germany the DAX 30 looks like it has plenty of downside potential until it meets support. We are looking at the 9000 to 8500 area for structural support.
In France the CAC 40 index is very close to its last support zone which is visualized as the purple band.
In the U.K. the FTSE 100 is at a make-or-break level ‘as we speak’.
Charts Of International Stock Markets In 2019: Asia
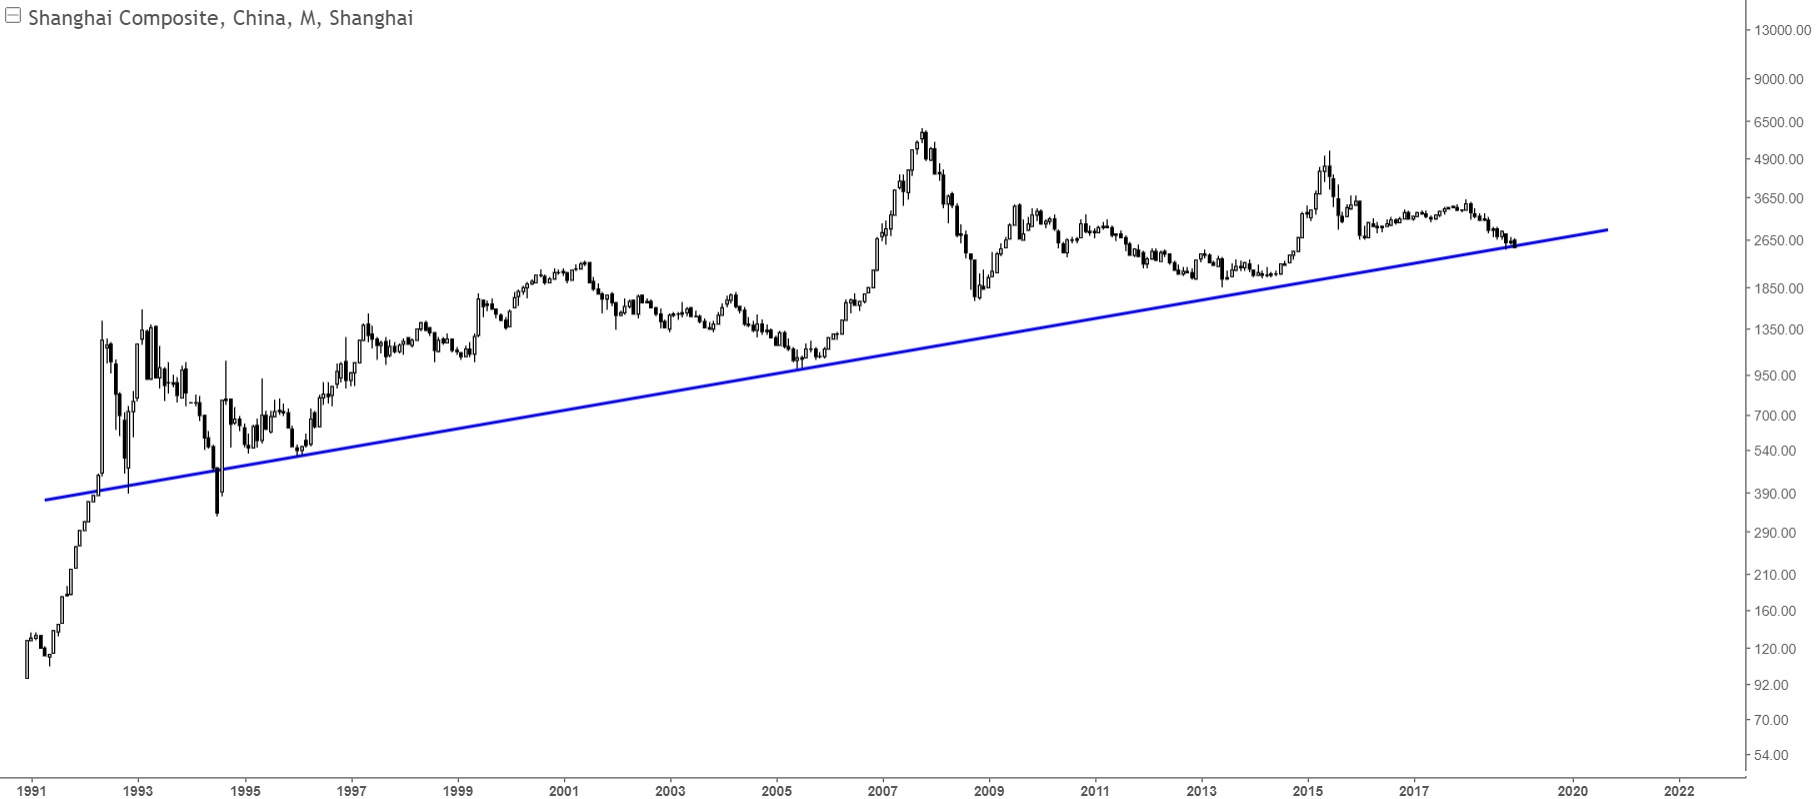
China’s Shanghai Composite index is flirting with multi-year trendline support. Make no mistake this is a major event as any break lower would invalidate a multi-decade bull rising trend. The opposite is true as well: as explained in our China Stock Market Forecast 2019 a successful test of this rising trend will result in a strong move higher in 2019.
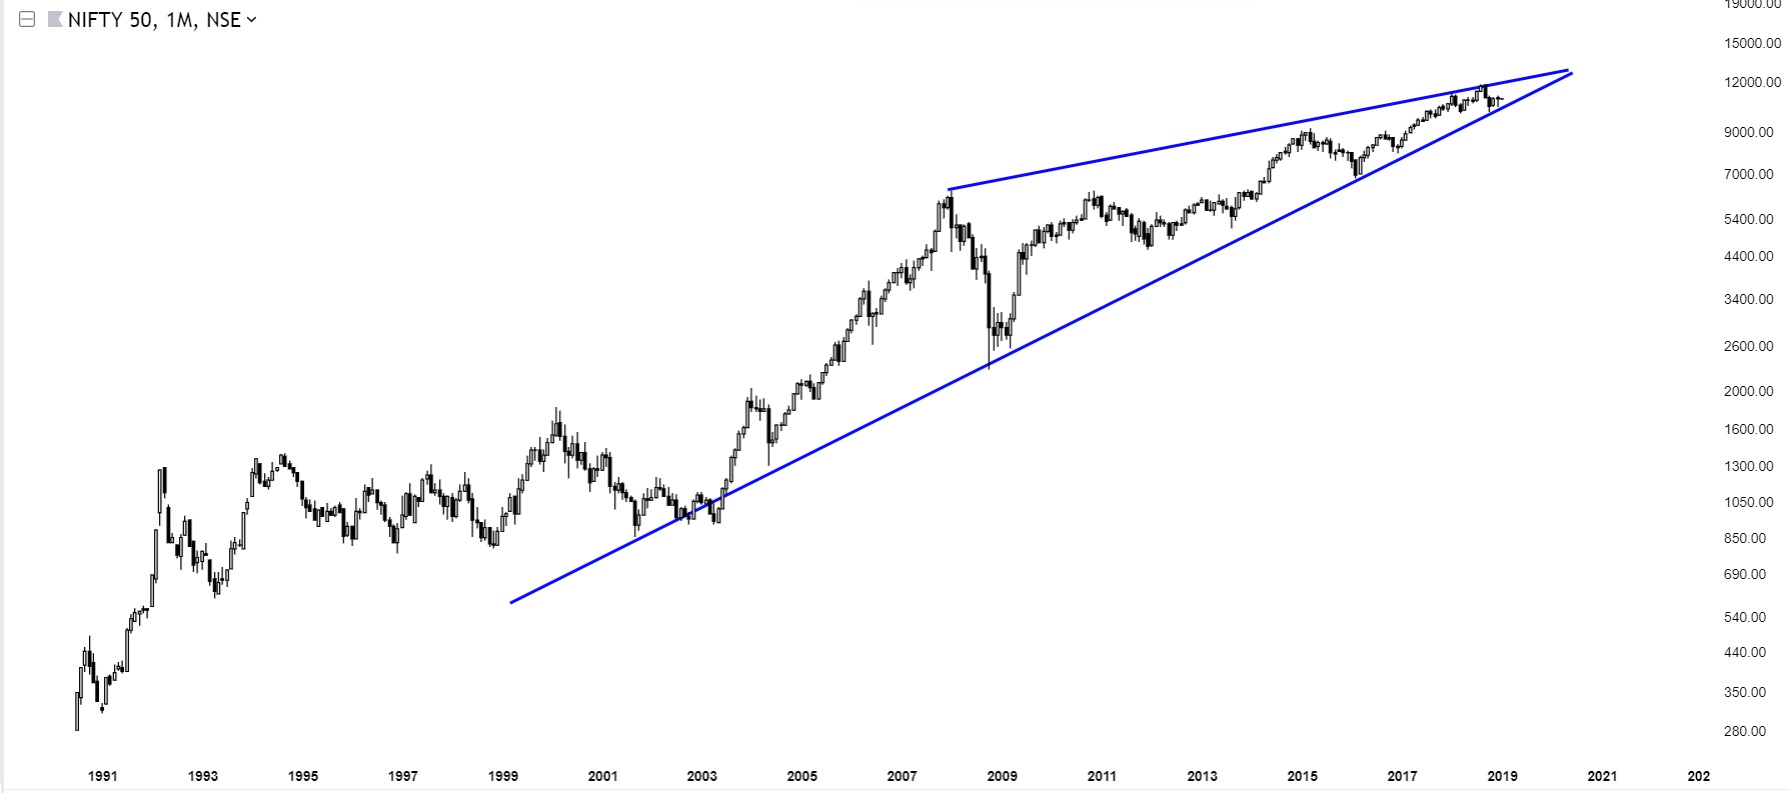
In India the Nifty 50 is trapped inside a multi-year triangle, and a big move is brewing as this index is moving closer to its apex. This was also explained in our India Stock Market Forecast 2019.
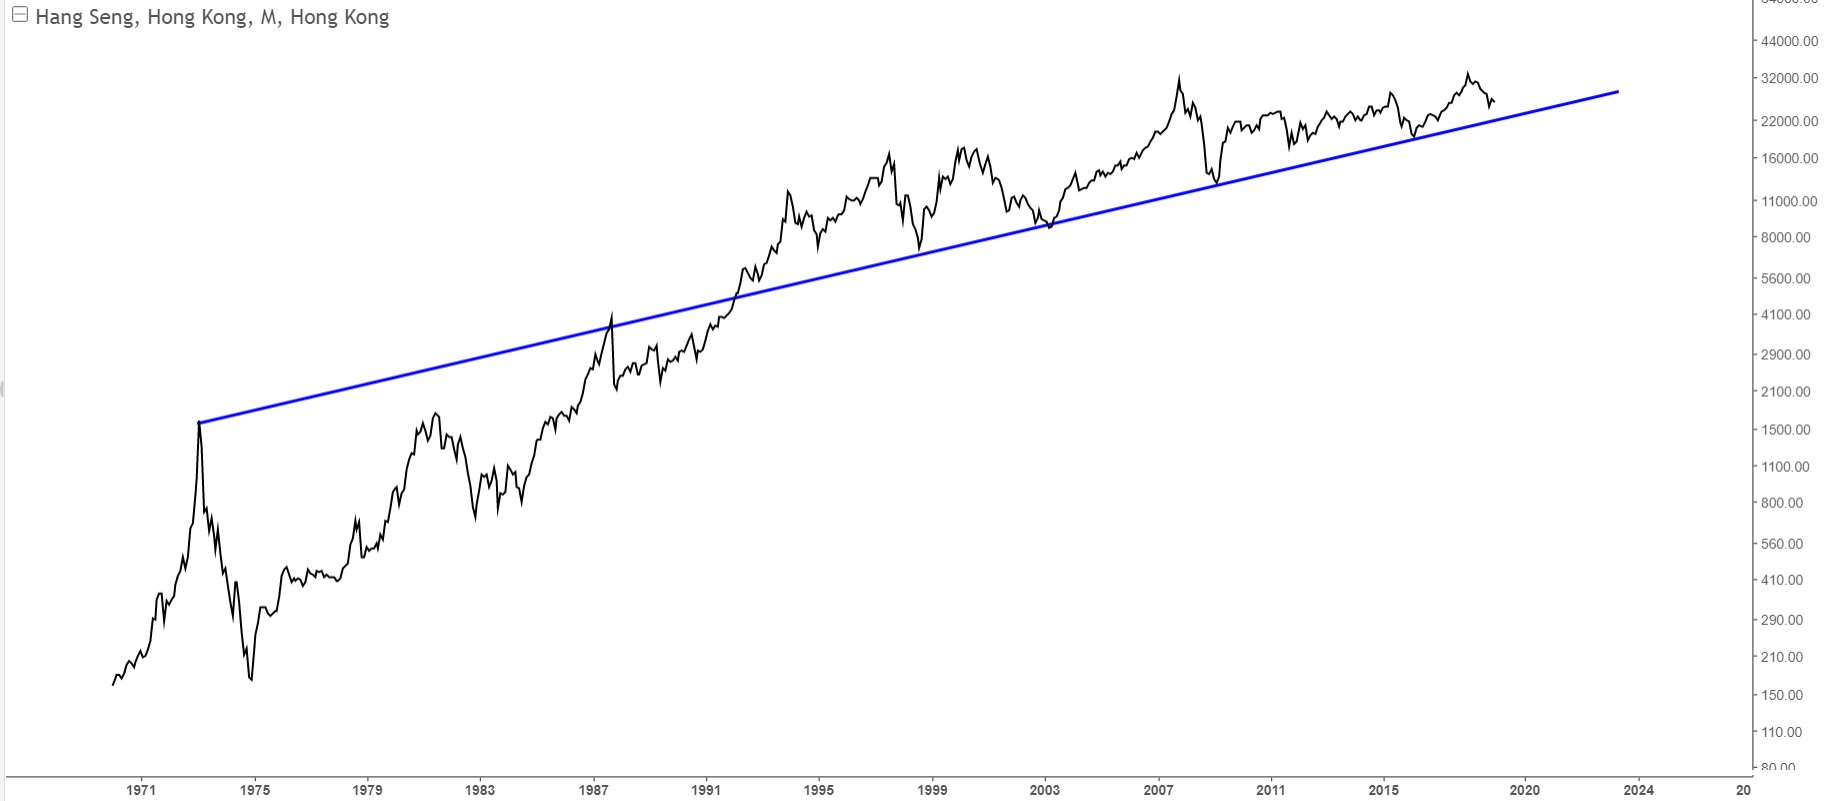
The Hang Seng Index has plenty of downside potential before breaching the uptrend line.
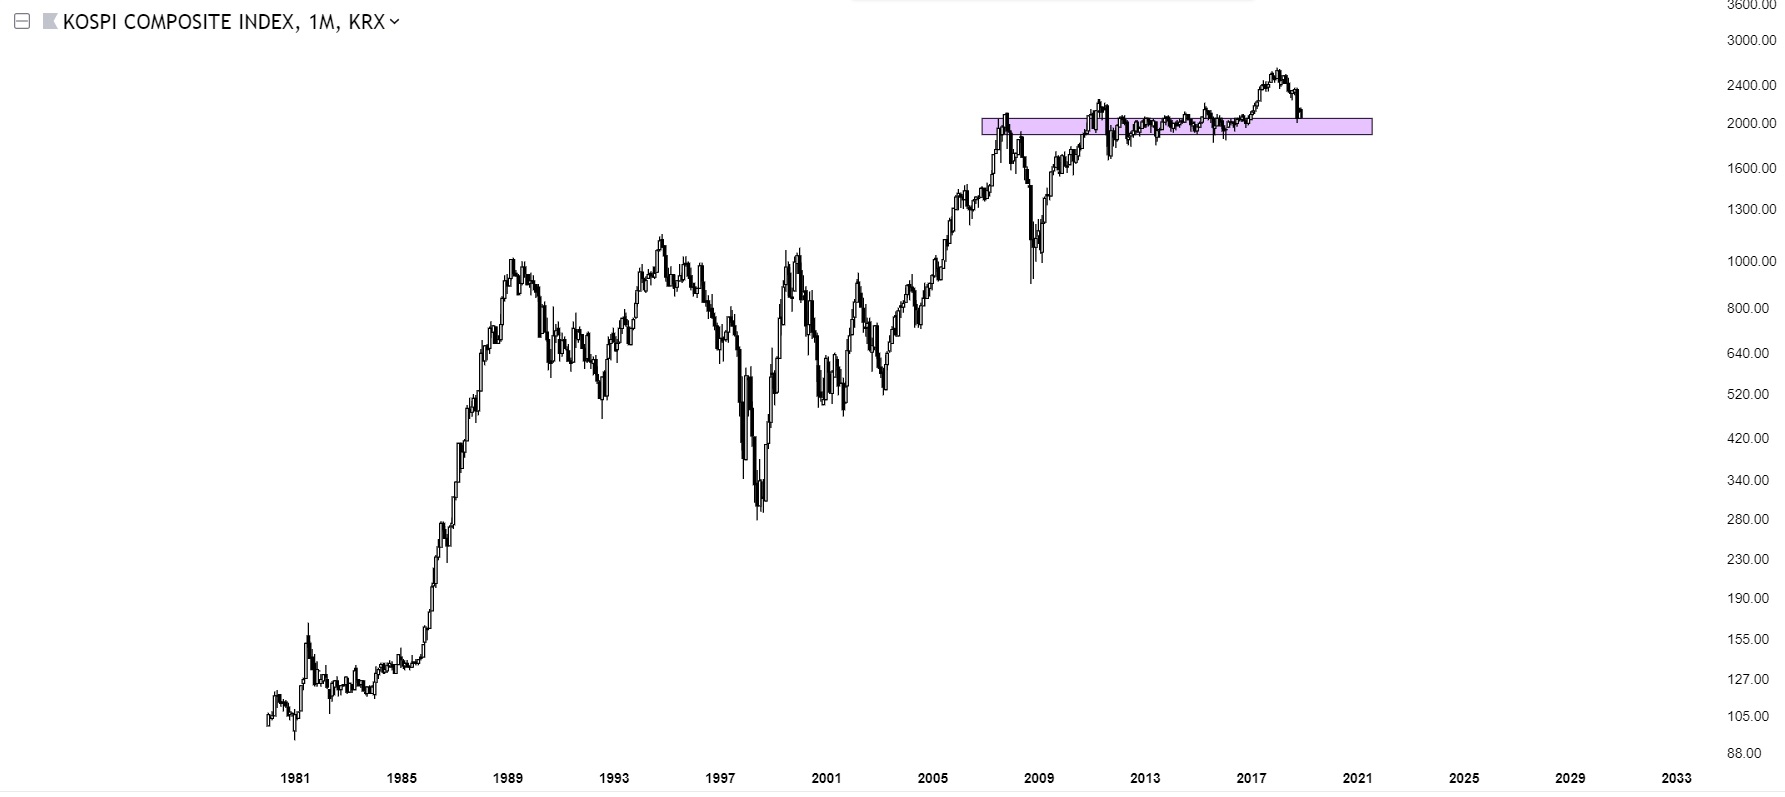
The Kospi index in Korea is currently testing its decade long support which is also its breakout point from last year.
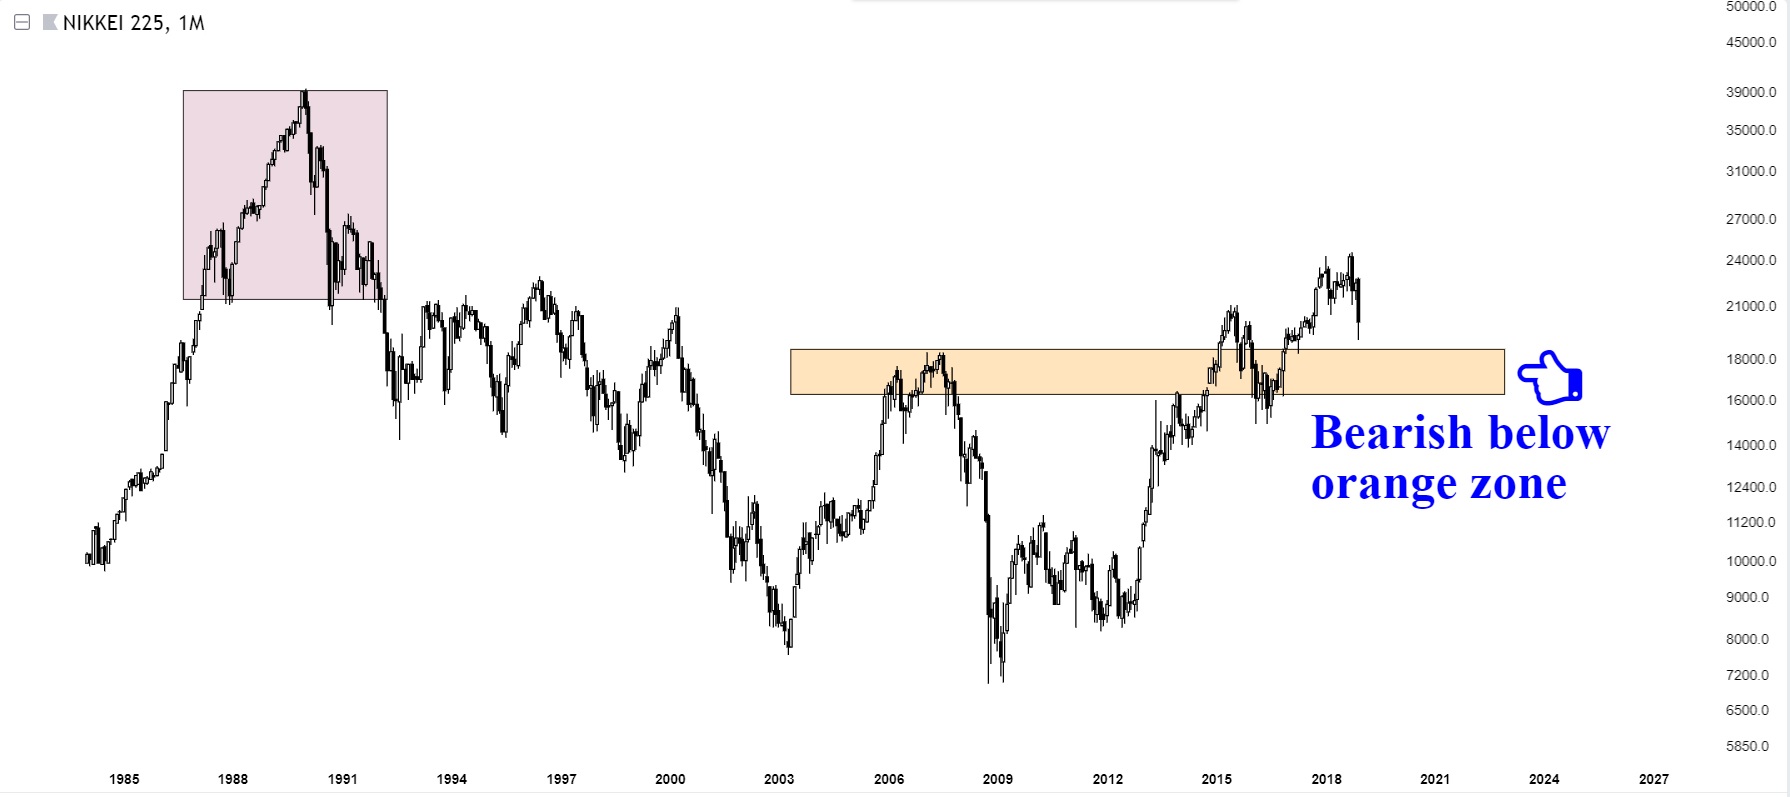
The Japanese Nikkei 225 index comes closse to horizontal support which is represented by the orange area. This area is a make-or-break level.
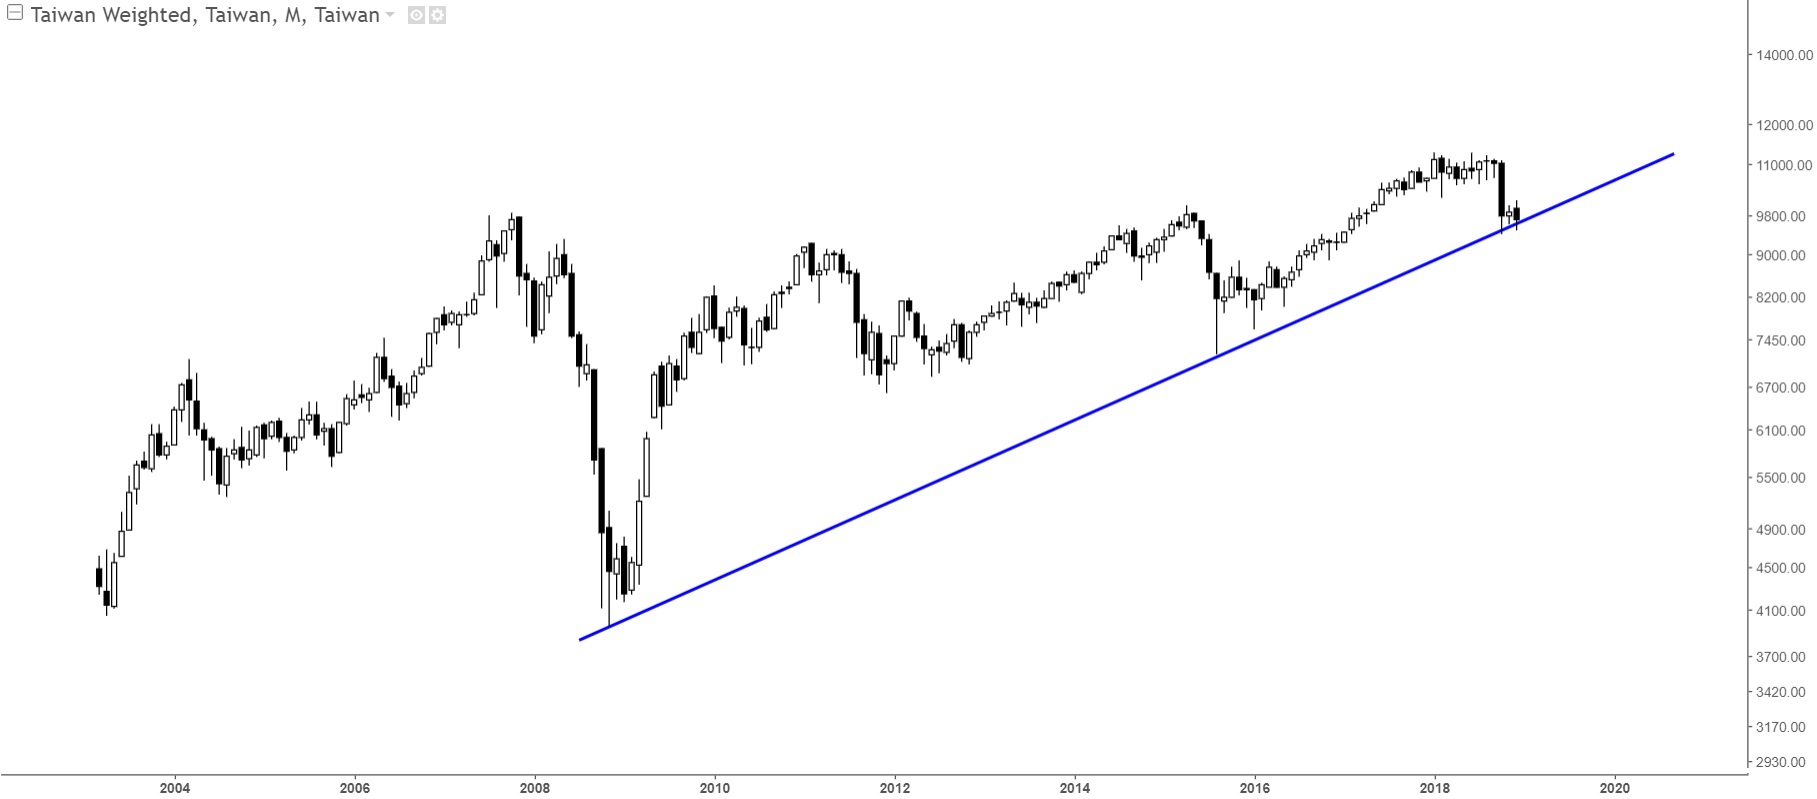
Taiwan’s weighted index is facing the same dilemma. It currently trades really at the intersection of the bullish vs. bearish zone.
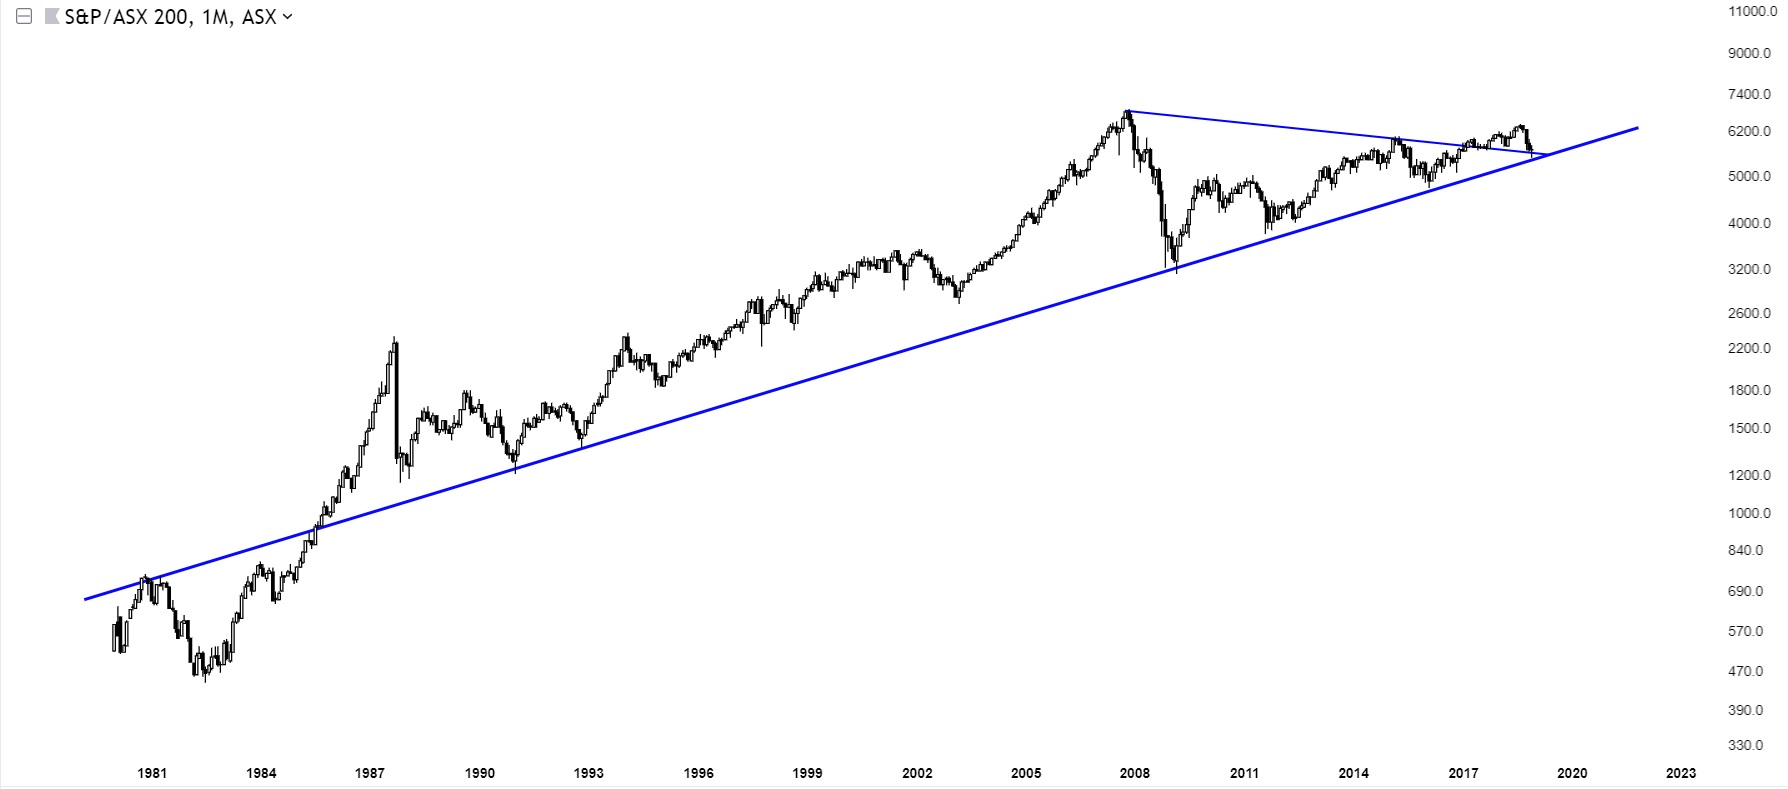
In Australia the ASX 200 index is visibly tesing its uptrend line, and is doing so very carefully.
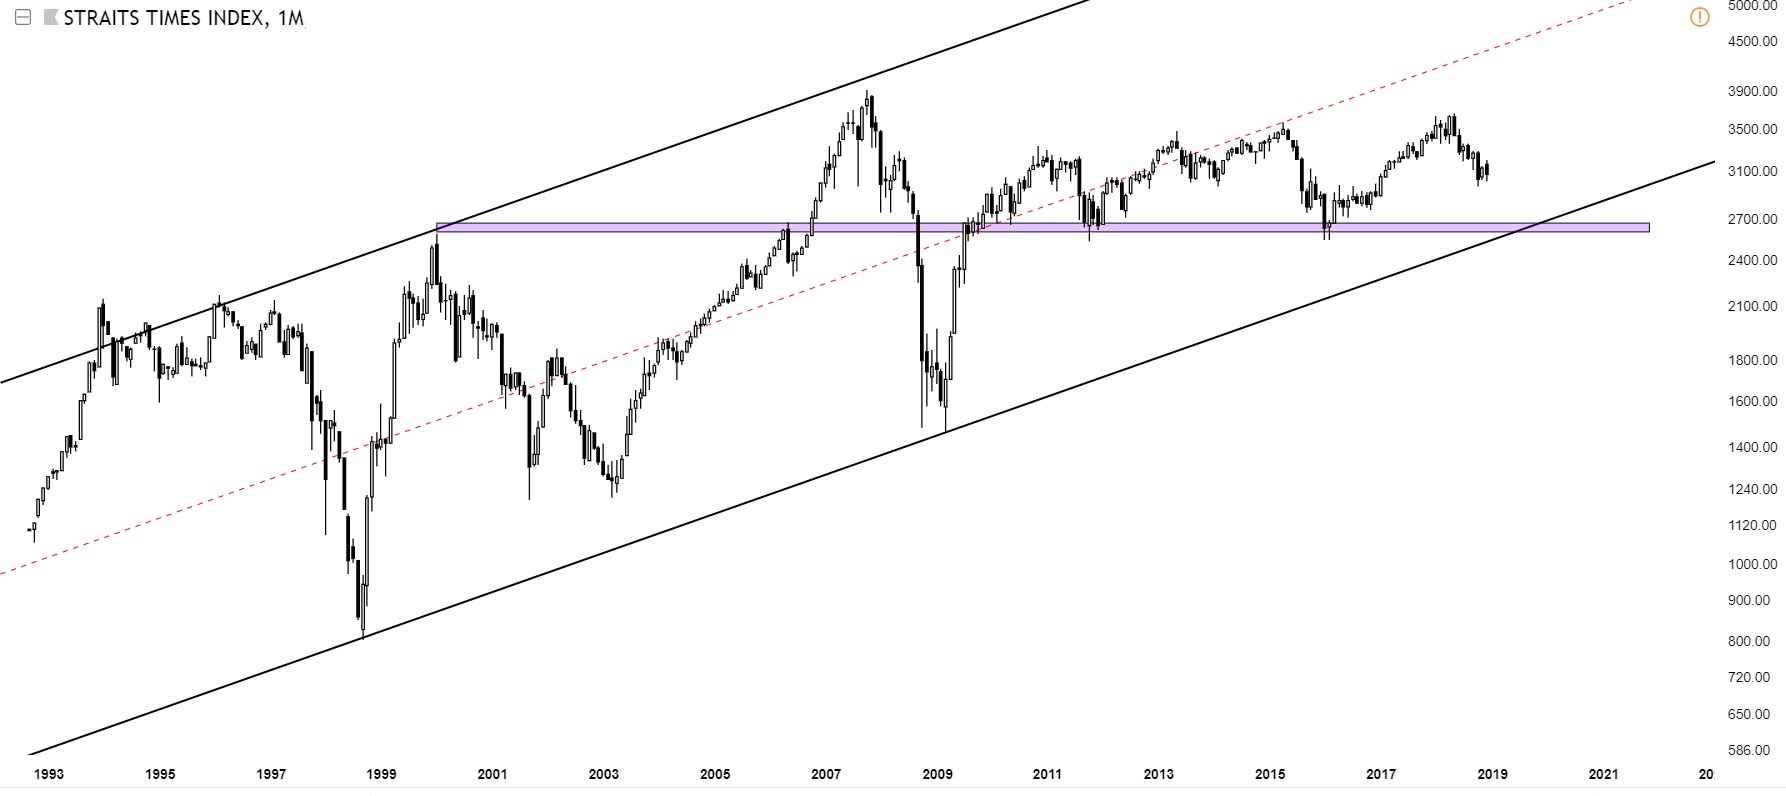
In Singapore the Strait Times Index is in multi-year sideways range which suggests high levels of uncertainty until proven otherwise.
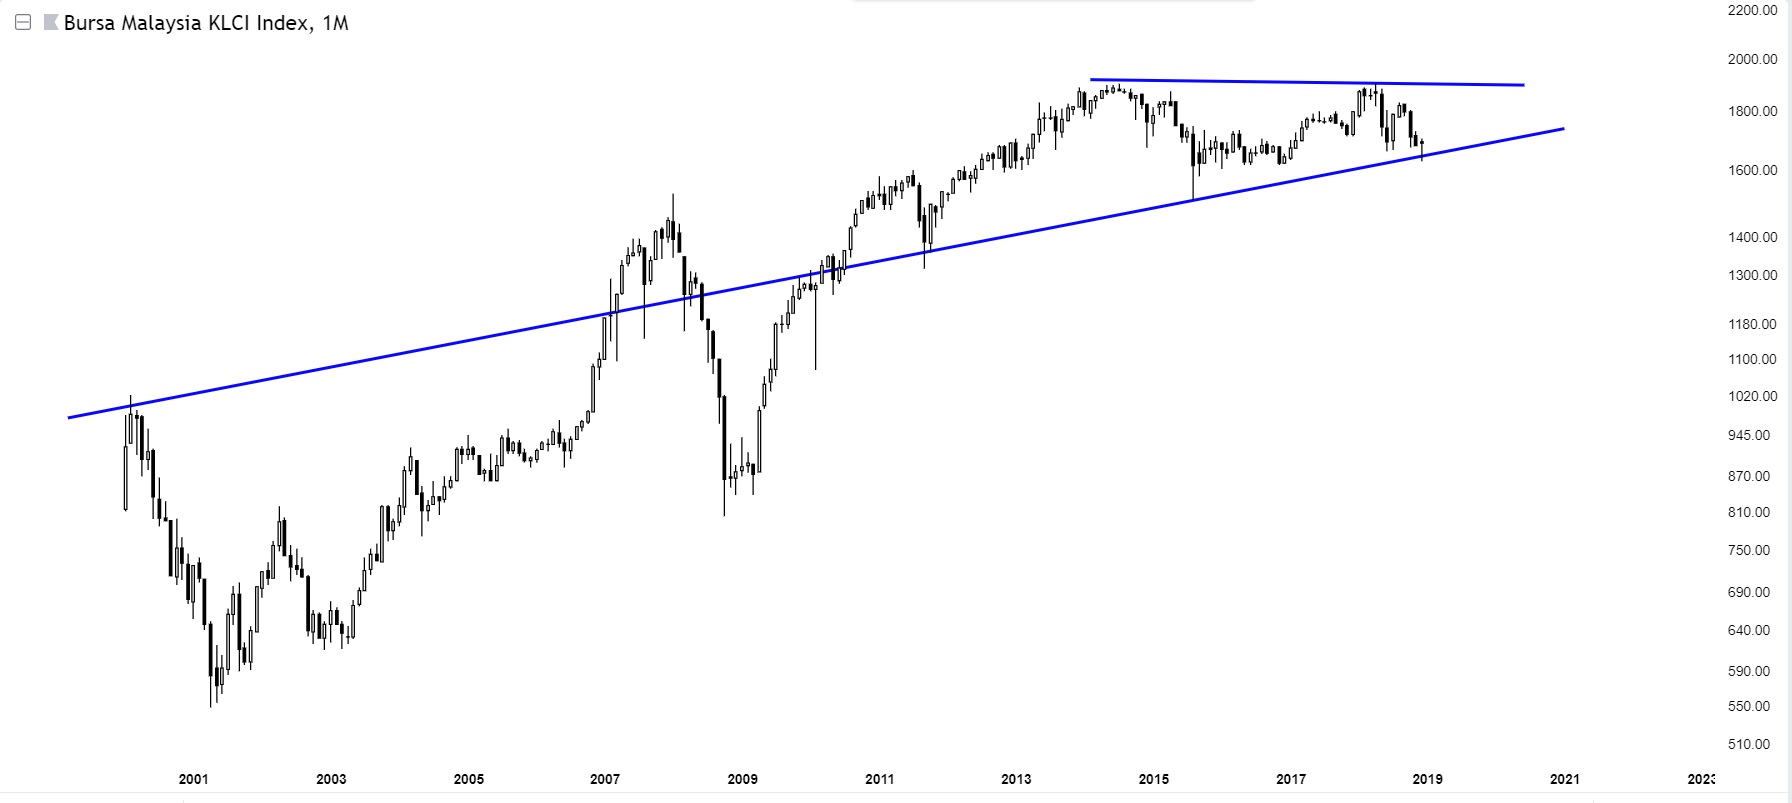
In Malaysia the KLCI index is testing a pivotal point similar to the indices above.
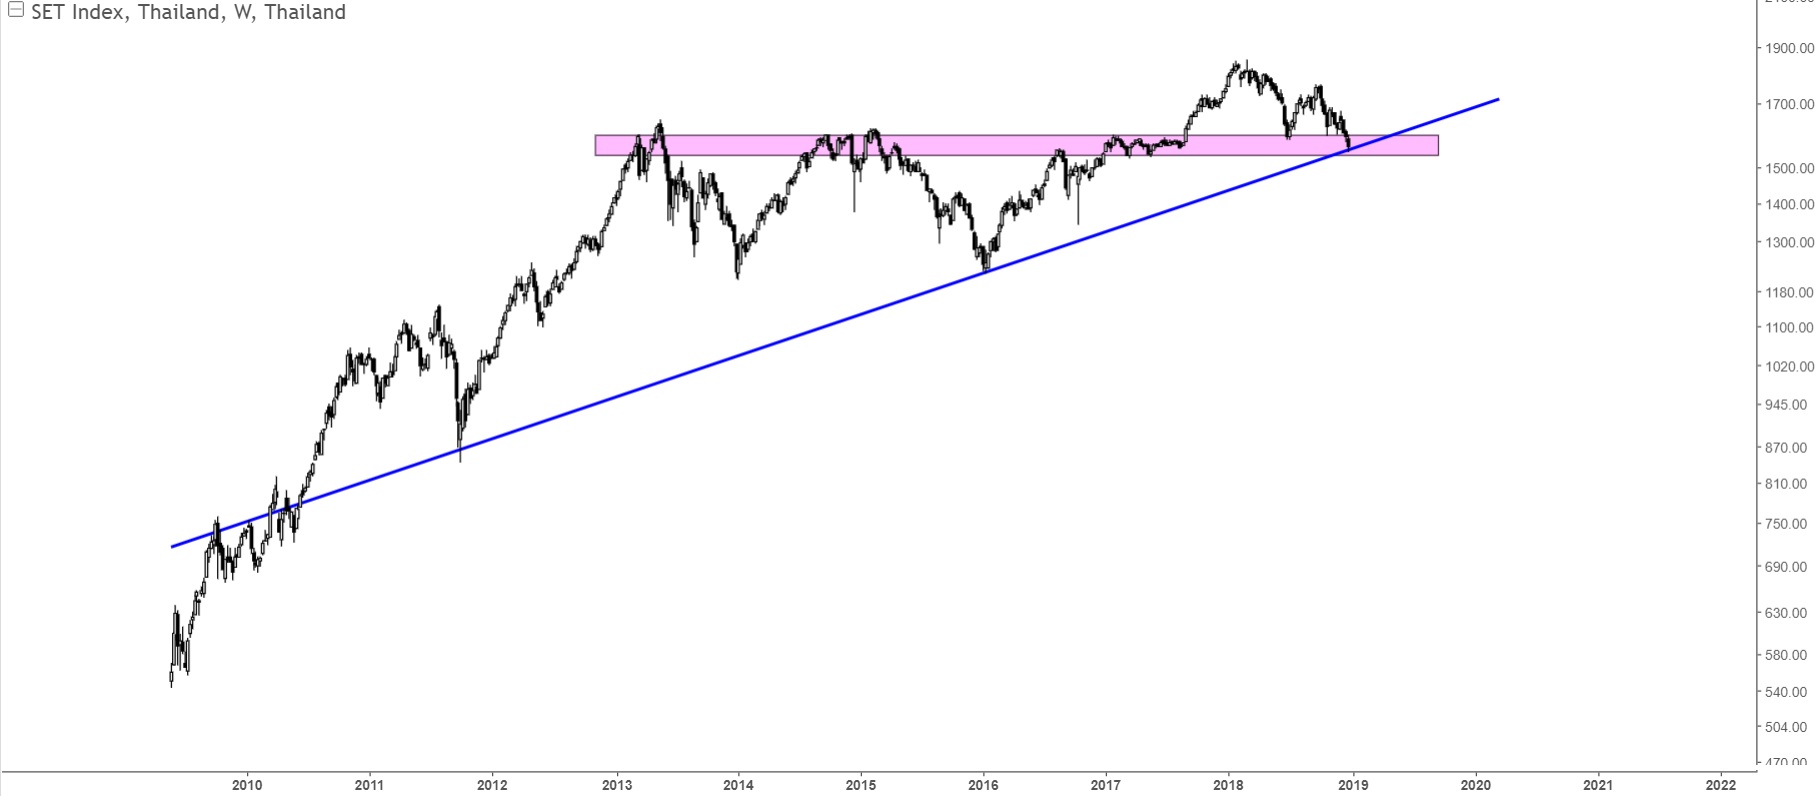
In Thailand the SETI index trades at dual support. This is a crucial level, and it goes without saying that the implications of any sustained move higher or lower are significant.
Charts Of International Stock Markets In 2019: Middle East
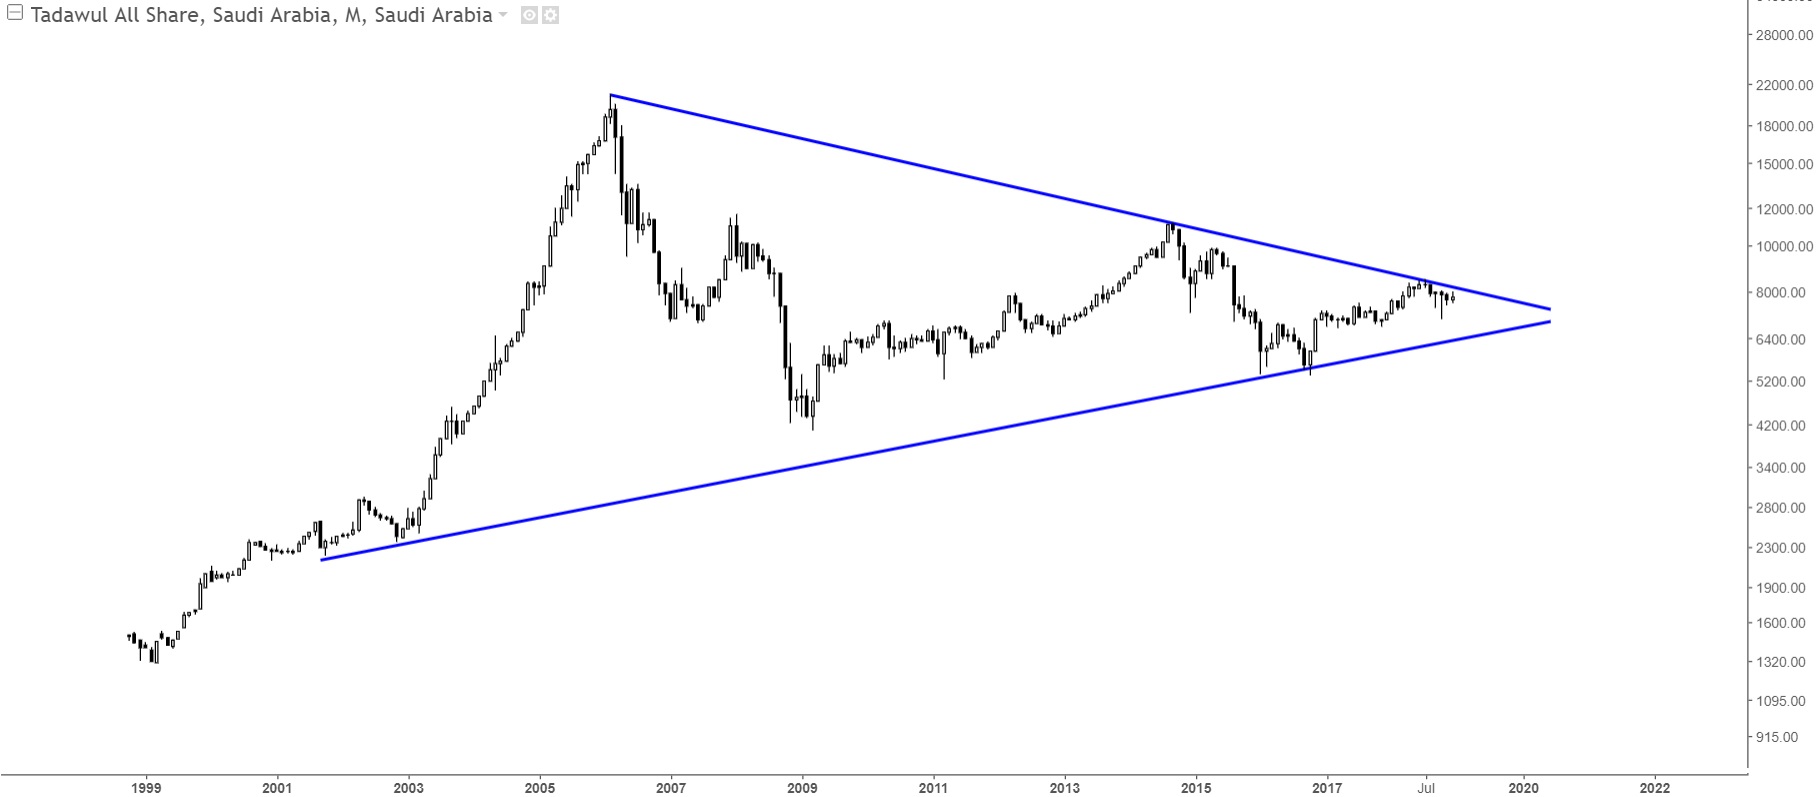
In Saudi Arabia we see that the Tadawul All Share index is making an attempt to break above the downtrend line, though more work is needed. It is one of the few indices that have a more bullish look.
Charts Of International Stock Markets In 2019: South Africa
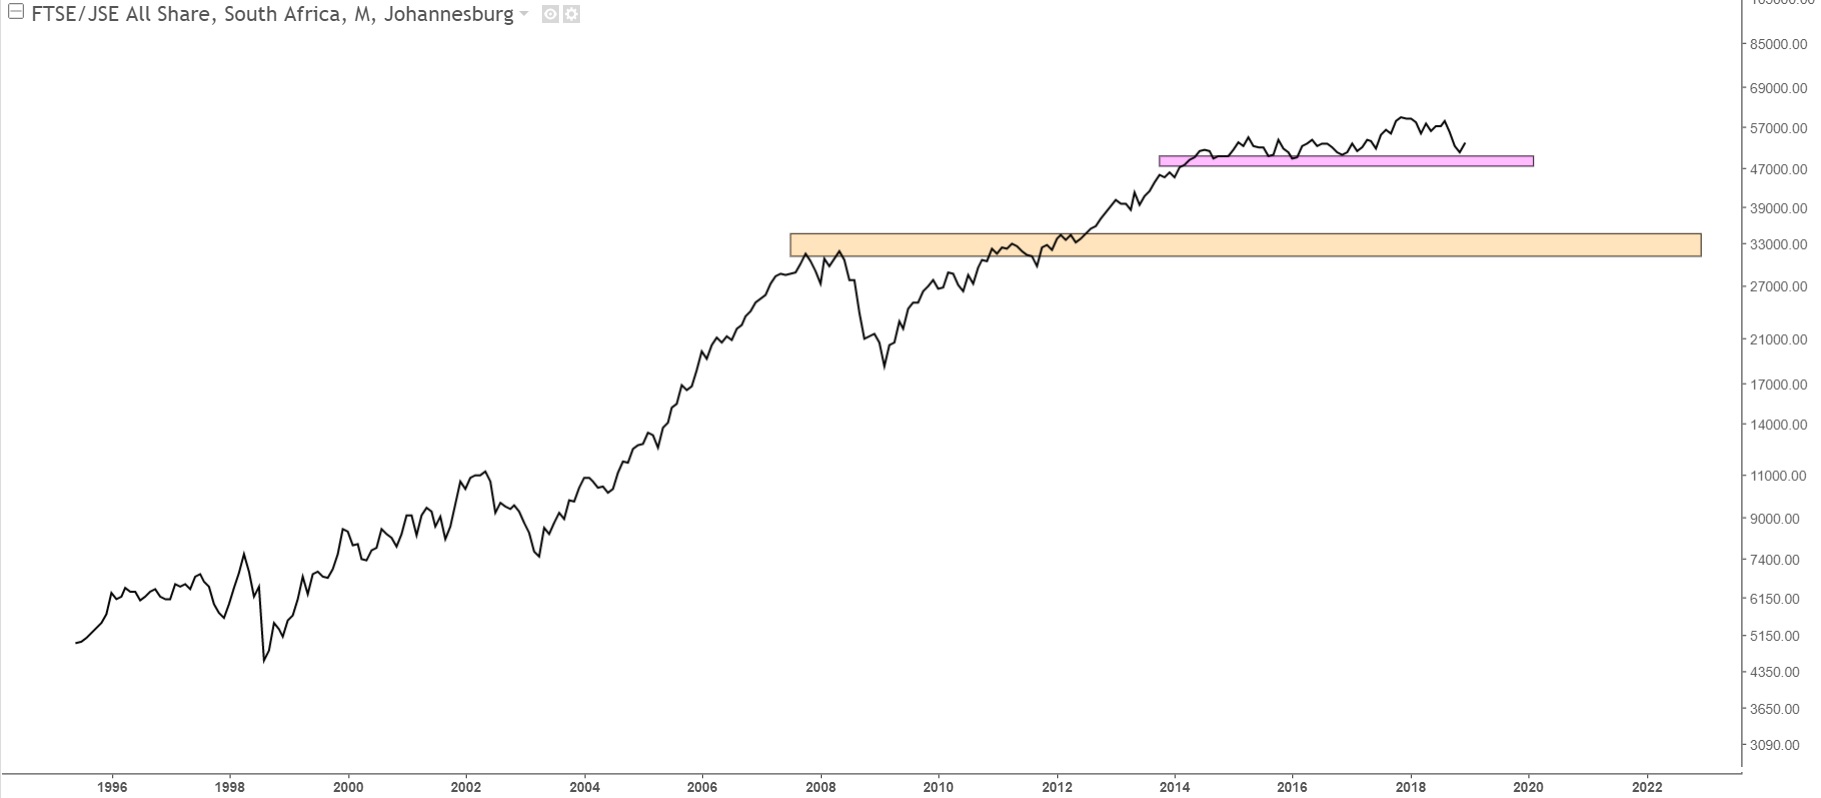
Last but not least, the South Africa stock index has retraced to the support zone, though not the last major support area.
20 Charts Of International Stock Markets In 2019: Conclusions
In sum the world economies have become more and more intertwined which likekly explains which the majority of world stock indices are behaving in a similar fashion.
We are comfortable projecting that a decisive direction will be established within the next 3-6 months, maybe even earlier. It will show the next trend in global stock markets especially in the 20 international stock markets discussed in this article.
It is a pivotal time for stock markets, and 2019 will show the way higher or lower.


