Investing
Haven
No Result
View All Result
Sunday, August 7, 2022
  • Login
  • Premium Services & Login
  • 2022 Forecasts
  • Commodities & Gold
  • Stocks
  • Crypto
  • Mission 2026
Crypto investing >>
Investing
Haven
  • Premium Services & Login
  • 2022 Forecasts
  • Commodities & Gold
  • Stocks
  • Crypto
  • Mission 2026
No Result
View All Result
InvestingHaven
No Result
View All Result

A Rare Megaphone Pattern On The S&P 500 Daily Chart

by Taki Tsaklanos
July 04, 2021
in Markets & Stocks
0
Tags: SPX
bull with mask
1.9k
VIEWS
Share on FacebookShare on Twitter

So far the naysayers: markets did not crash, on the contrary. There were no signs whatsoever of a crash in our crash indicators. All we saw was a possibility of a healthy retracement, nothing more nothing less. However, the market decided to move higher. This is the start of a new 3 month cycle, so we pay extra attention to what’s happening at critical price points.

We focus on the S&P 500 in this article, not only because it’s a leading index but also because it is the index we trade in the short term in our Trade Alerts portfolio. Our premium members receive detailed analysis of the S&P 500 but also leading indicators, every weekend.

The chart we include in this short post comes from this weekend update, and exceptionally we’ll pick out a few quotes from our weekend reading to premium members.

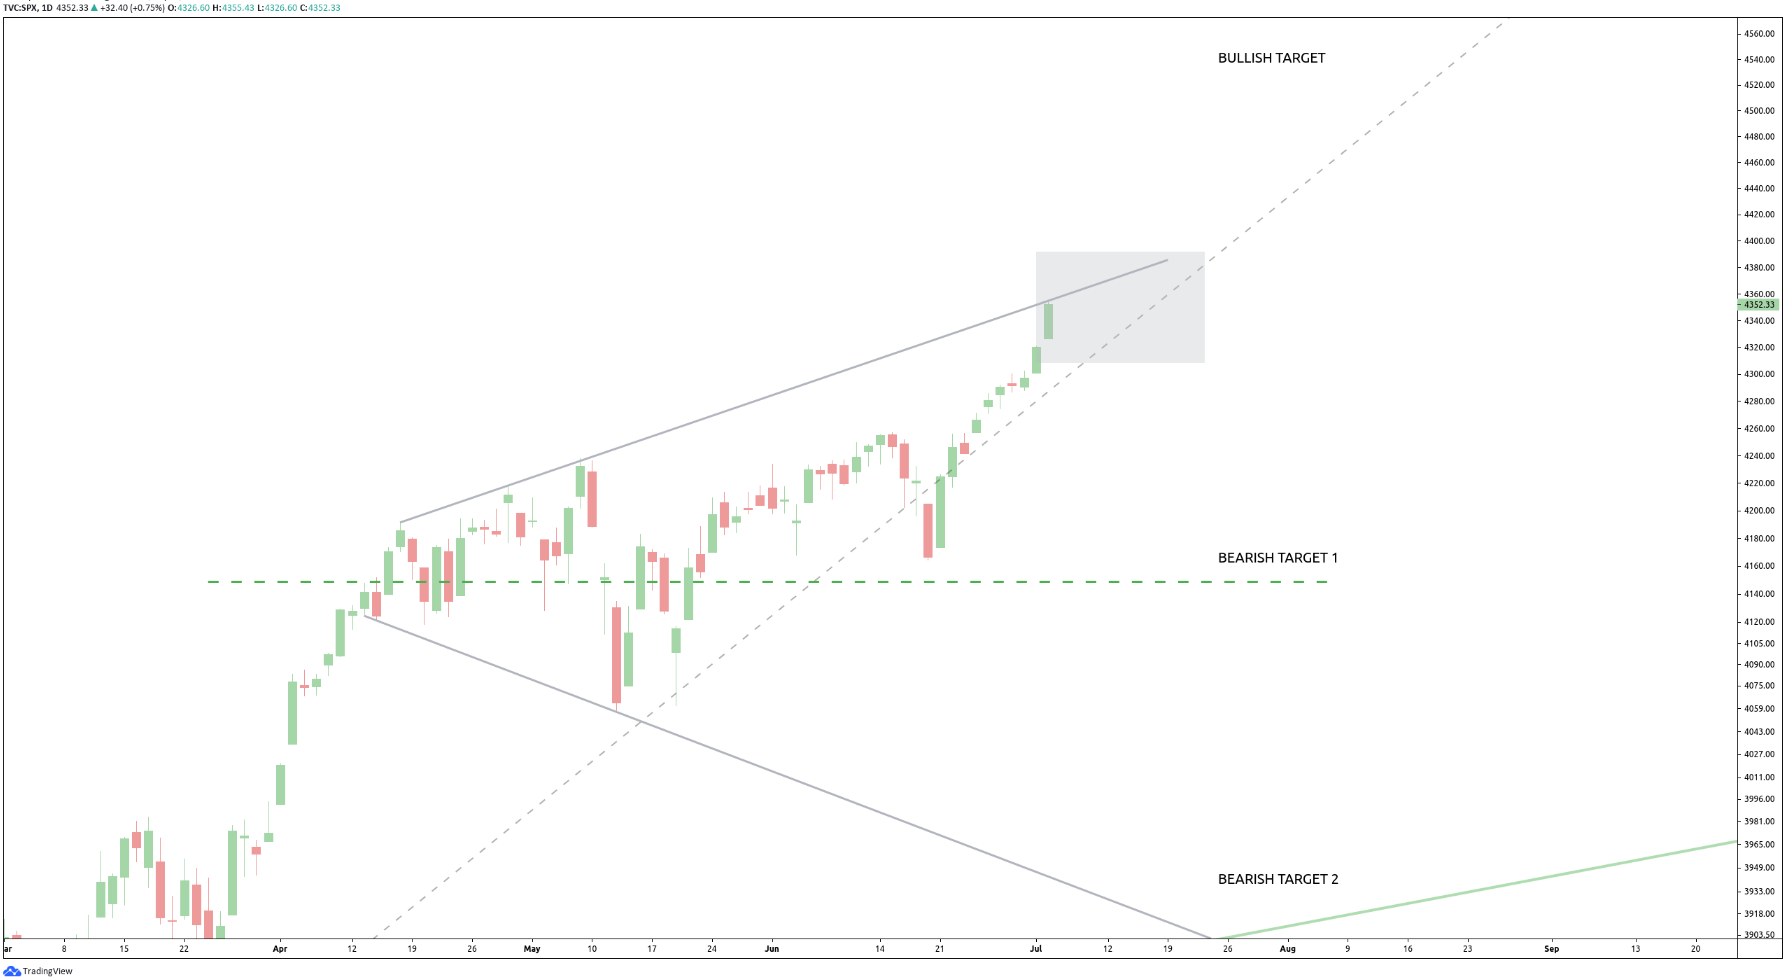
The S&P 500 daily chart has this megaphone pattern which we noticed more than a month ago. Note that we are not trading patterns, our algo flashes buy/sell signals based on price point analysis and calculations. However, as humans we can easily spot patterns which explain why our algo flashes signals.

Megaphone patterns on the daily chart are not common, is what we wrote in our premium service. From our research it appears that megaphone patterns are common on short term charts, but the difference between those patterns on short vs. long term charts is that they tend to lead to failed breakouts and failed breakdowns on the short term charts.

This is the way we read this chart, and what we copied from our premium research:

  • The bullish outcome of the above megaphone pattern is a breakout above Friday’s high. This would open the door to 4570 points (approximately).
  • The bearish scenario would bring the S&P 500 to the 4150 ~ 4100 area. Ultimately, this index may fall to around 3900 points. This is not a forecast, it’s a possibility.

We believe that the most likely scenario is bullish one. We cannot exclude a good consolidation with a some continuity reversals which will continue to push this index to a series of new ATHs.

Note that this is not a forecast. We rather outline possibilities. And short term trading requires market participants to have no bias nor be acting/thinking from forecasts. All that matters is factual price analysis and trend following. That’s why an algorithm is so important.

In our Trade Alerts service we are about to launch an auto-trading service.

s&p 500 daily chart

  premium service trade alerts   premium service trade alerts   premium service crypto teaser  
Receive top notch forecasts for free.

*We hate spam as you do.

  premium service trade alerts   premium service trade alerts   premium service crypto teaser  
Receive top notch forecasts for free.

*We hate spam as you do.

Taki Tsaklanos

Taki Tsaklanos

Taki has +15 years of experience in global markets. His methodology is unique and effective, yet easy to understand; it is based on chart analysis combined with intermarket / fundamental / sentiment analysis. His work appeared on major financial outlets like FinancialSense, MarketWatch, ... Email: taki.tsaklanos@gmail.com. Twitter: twitter.com/investinghaven

Latest

semiconductor stocks

This Semiconductors Segment Is Outperforming The Market… And Will Continue To Do So

July 31, 2022
lithium mining stocks

The Only Commodity Not Impacted In 2022, Currently Right Below ATH

July 31, 2022
staglation

Gold’s Chart Suggests Stagflation Is Here To Stay In 2023 And Beyond

July 31, 2022
btc price forecast

Will Bitcoin Move Back To 30k?

July 31, 2022

Connect with InvestingHaven

Receive top notch forecasts for free.

*We hate spam as you do.

Categories

  • Premium Services & Login
  • 2022 Forecasts
  • Commodities & Gold
  • Stocks
  • Crypto
  • Mission 2026

Site Navigation

  • RSS Feed
  • About us
  • Sitemap
  • Privacy & Disclaimer
  • Terms of Service
  • Contact Us
Investing
Haven

Top notch forecasting with gold price forecast, many stock predictions, cryptocurrency charts. Many investing tips and crypto market analysis.

Copyright © 2022 Investing Haven

No Result
View All Result
  • Premium Services & Login
  • Premium Investing Service
  • Premium Trading Service
  • Premium Crypto Service
  • 2022 Forecasts
  • Markets & Stocks
  • Commodities & Gold
  • Crypto Markets
  • Mission 2026

Copyright © 2022 Investing Haven

Login to your account below

Forgotten Password?

Fill the forms bellow to register

All fields are required. Log In

Retrieve your password

Please enter your username or email address to reset your password.

Log In