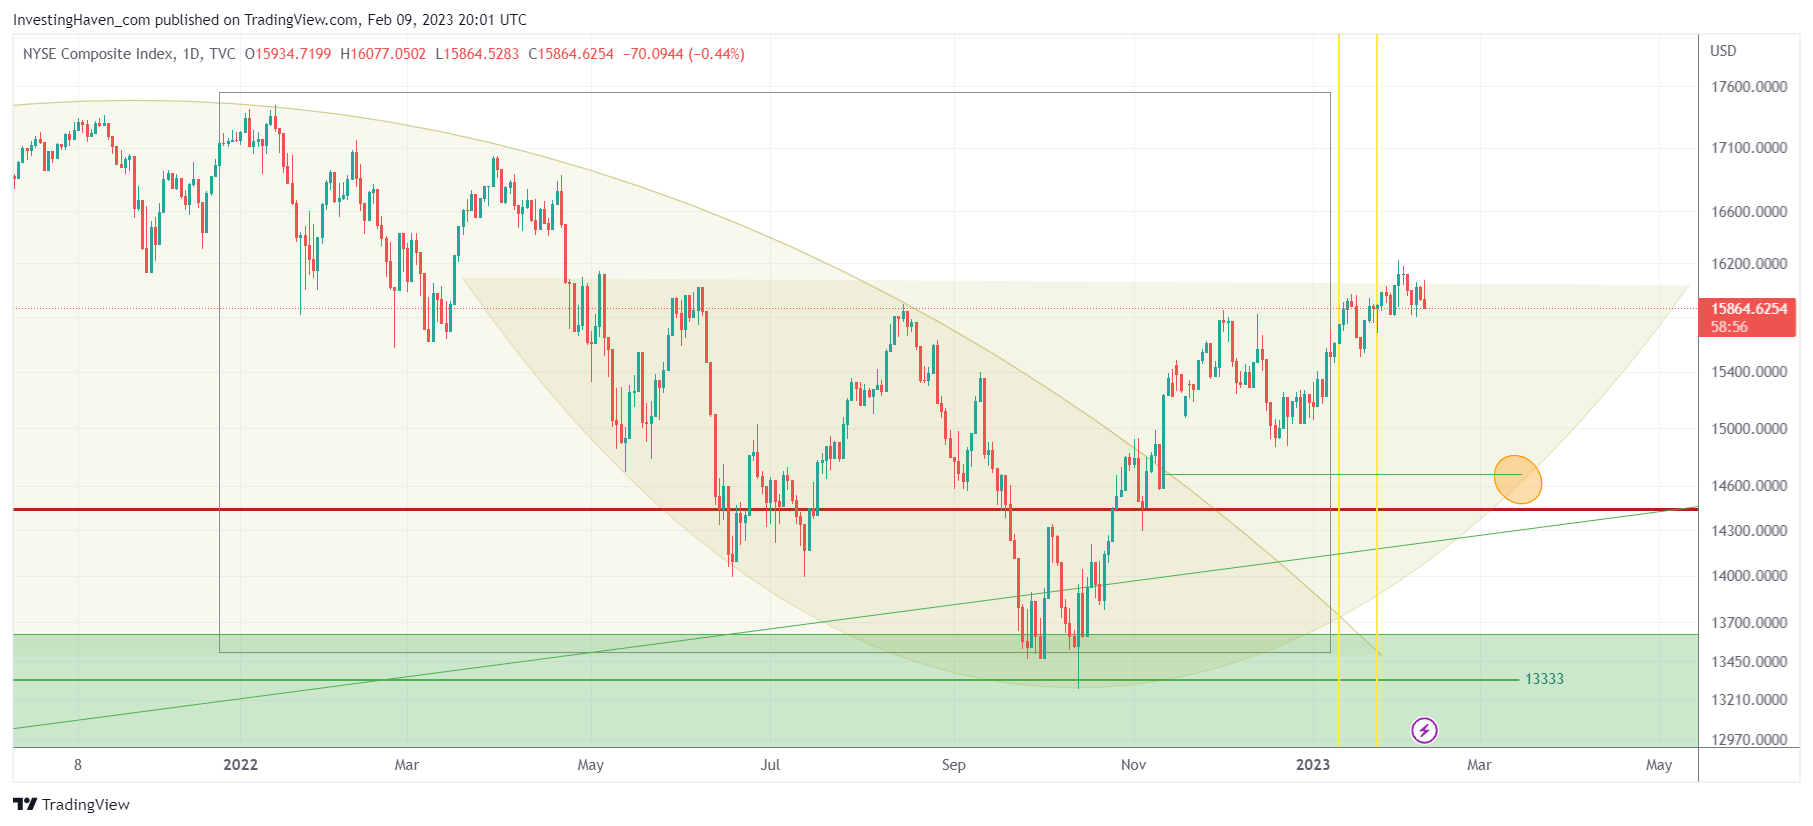
The NYSE Composite Index closed the week at the exact same price point as 2 months ago. In essence, after the nice October rally, leading indexes like the NYSE and the Dow Jones were range bound. That’s not a bad thing, but also not a sustainable thing. As said, a pullback is underway. Here is one chart from our premium research service Momentum Investing that has a potential target. Yes, we do forecast a pullback between mid-Feb and mid-March which should be a ‘buy the dip’ opportunity and confirm the nascent bull market in stocks (one of our 2023 market trends). Again, this pullback will not be the start of a crash, no market crash in 2023.
Below is the NYSE Index chart, with our annotations.
As seen, the market transitioned from a bearish rounded (topping) pattern to a bullish rounded (reversal) pattern on Nov 9th, 2022. In essence, the ‘breakout price point’ is the one that we believe will be tested again, somewhere in the next few weeks.
The small orange circle on the chart is the price point that we believe will be tested. In terms of timing, somewhere in the first week of March is this price point coinciding with the rounded pattern. Whenever two dominant patterns or trendlines coincide, you better mark that day in your calendar.
Our expectation is that a pullback to 14700-14900 is a real possibility, in the next 2 to 4 weeks from now.
We believe it will be a ‘buy the dip’ opportunity.
In our Momentum Investing service, we are preparing a shortlist of stocks that we want to buy on the dip, not only but also in the AI & Big Data space.


