The Dow Jones Index printed a series of all-time highs (ATH) in 2024. New highs are expected in 2025.
RELATED – Market forecasts for 2025
The shorter term Dow Jones timeframe is creating a lot of excitement among investors, with this leading index printing quit some new ATH in 2024.
The divergence with small cap stocks remains significant.
Arguably, when momentum returns in markets, small caps will outperform large caps. That’s because this current market cycle is characterized by epic rotation.
We expect this rotational dynamic to continue in 2024 which is why, ultimately, the Dow Jones should reach new all-time highs in 2024. The outlier, of course, is small caps who might have more upside potential.
Dow Jones Index long term charts
From our chart analysis in Dow Jones Long Term Chart On 20 Years:
The Dow Jones long term chart on 20 years suggests that a 24-month risk-off period is near completion which bodes well for 2024.
September 13th – The above mentioned Dow Jones forecast, written in 2023, was proven accurate, with a series of all-time highs in the Dow Jones in 2024.
In Dow Jones Historical Chart On 100 Years we looked at the secular, longest term chart pattern:
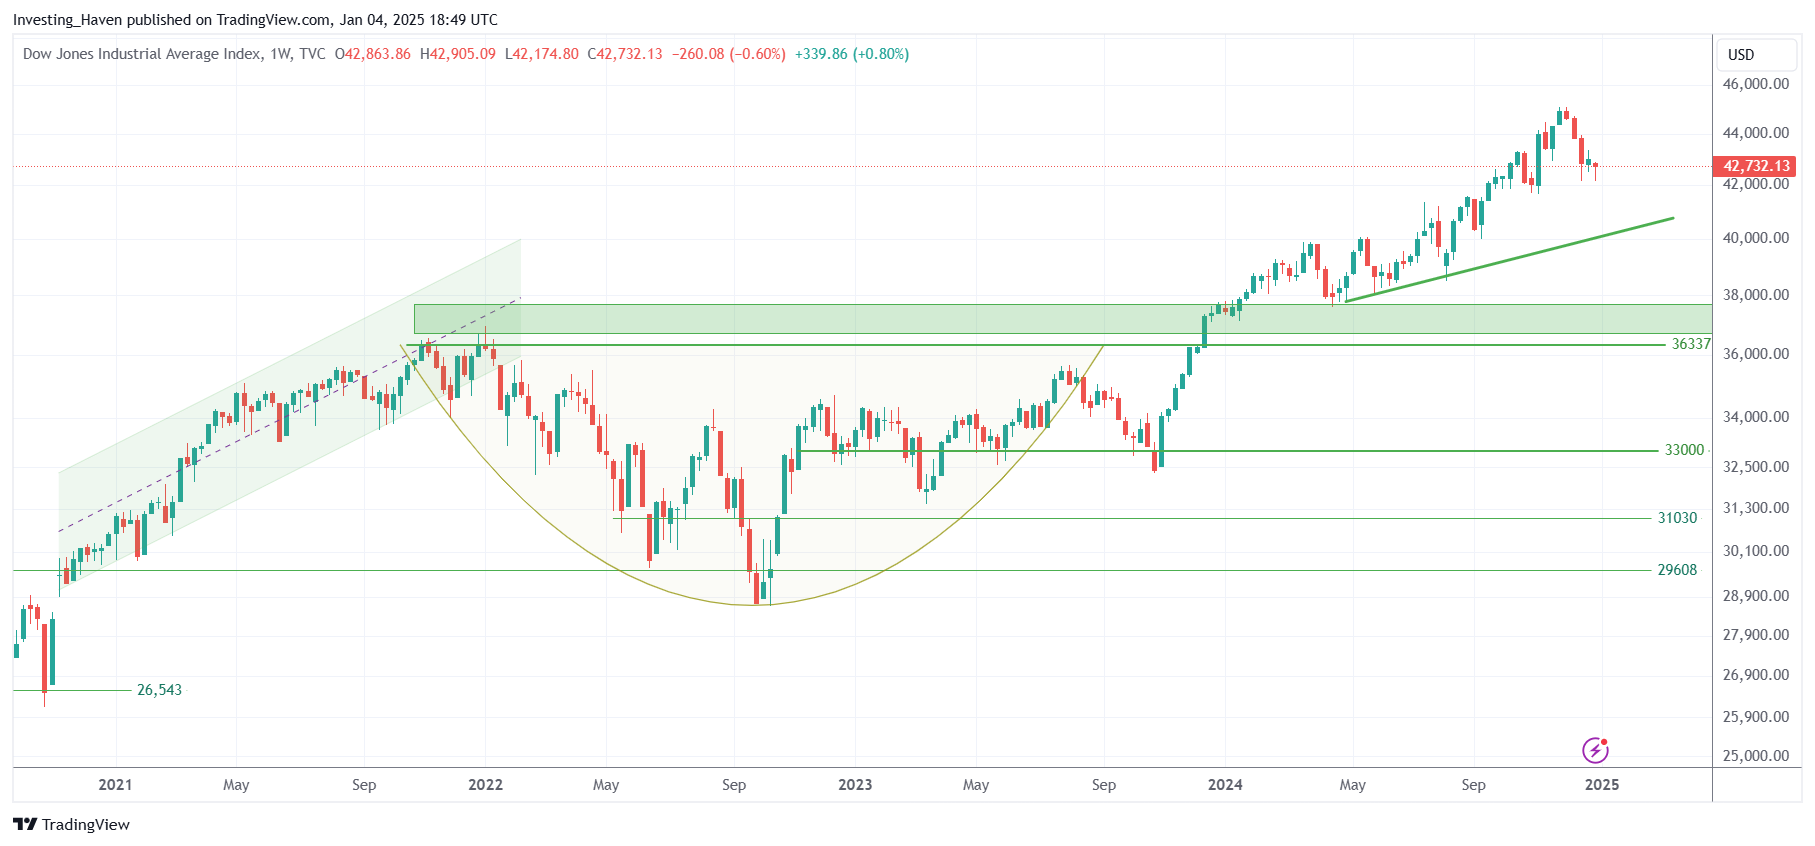
We do expect that the Dow Jones will conclude its consolidation in 2023. This should open the door for a breakout early 2024. We should remain cautious in the summer of 2024. One potential scenario is a breakout above 36k points early 2024, followed by a strong rally and a re-test of 36k points. Note that we may derive other scenarios from our charting and timeline analysis, however we prefer to re-visit the scenarios early 2024.
September 13th – The above mentioned Dow Jones forecast, written in 2023, was proven accurate, with a series of all-time highs in the Dow Jones in 2024.
Dow Jones Index ATH in 2024 & 2025
What we expect is increased volatility as the Dow Jones enters year-end, with presidential election and potentially geopolitical tensions picking up again (because those tensions tend to move intensify and soften, every quarter, which is a pattern that is expected to persist).
As said many times, volatility is rotation in disguise. So, as the Dow reaches new highs, volatility will pick up and investors should be looking for signs whether rotational effects will kick in.
While we believe the Dow Jones will sooner or later will print new highs, we also do expect higher volatility levels and rotation to pick up.
January 4th – The Dow Jones Index weekly chart looks very constructive. Whenever volatility picks up again, which might happen in March and/or May, the max downside is to the $38-40k area.


