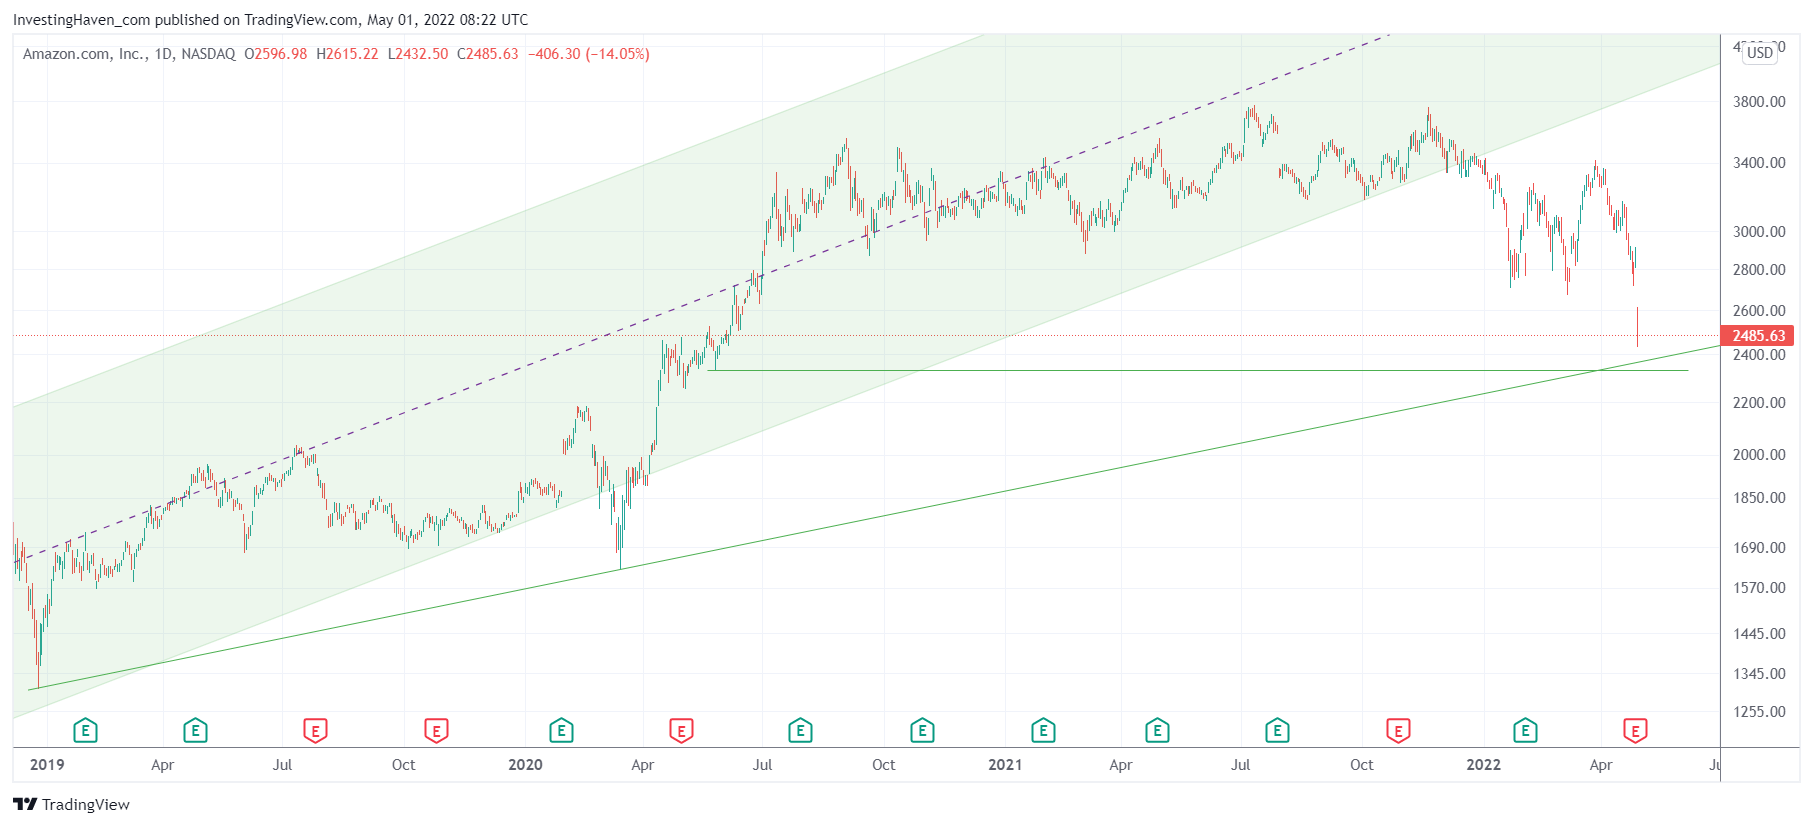
Amazon’s stock price started crashing on Thursday after market, triggered by disappointing earnings. On Friday, Amazon closed the session 14% lower. An epic decline for a big cap stock. The question comes up: is this the beginning of an epic decline or the end? Overall, we believe that the market remains in a long term uptrend as long as the Dow Jones trades above its 100 year chart. However, we want to be more specific as it relates to the tech sector.
As said in Tech Stocks: Multi-Year Decline Underway Or Long Term Buy Opportunity we see pessimism in the Nasdaq reaching historic levels. We looked at one breadth indicator (stocks above their 200 DMA) to come to this conclusion, but there are many more indictors that signal the exact same thing.
If we break down the Nasdaq in two segments (the top 7 with the largest market cap vs. the rest) we start seeing an interesting picture:
- In 2021: most tech stocks started selling off, and breadth started sinking and stinking. However, the Nasdaq index was moving higher just because the top 7 was so strong.
- In 2022: the largest cap tech stocks are coming down, drastically, while the rest of Nasdaq tech stock continue to move lower.
It does make sense to analyze the top 7 to understand if and when they will lead the market lower vs. higher. With ‘higher’ we mean to say when they will end their decline, they might not start a strong bull run immediately.
Here is the Amazon chart with what we consider the ‘line in the sand’ price level: the 2250-2400 area. We identified similar areas for the other top 7 Nasdaq stocks, and will be sharing them today in our Momentum Investing weekend alert. In looking at tech stocks in this ‘aggregate way’, we start seeing a clear picture for the Nasdaq which helps understand if this is the end of selling or merely the beginning.


