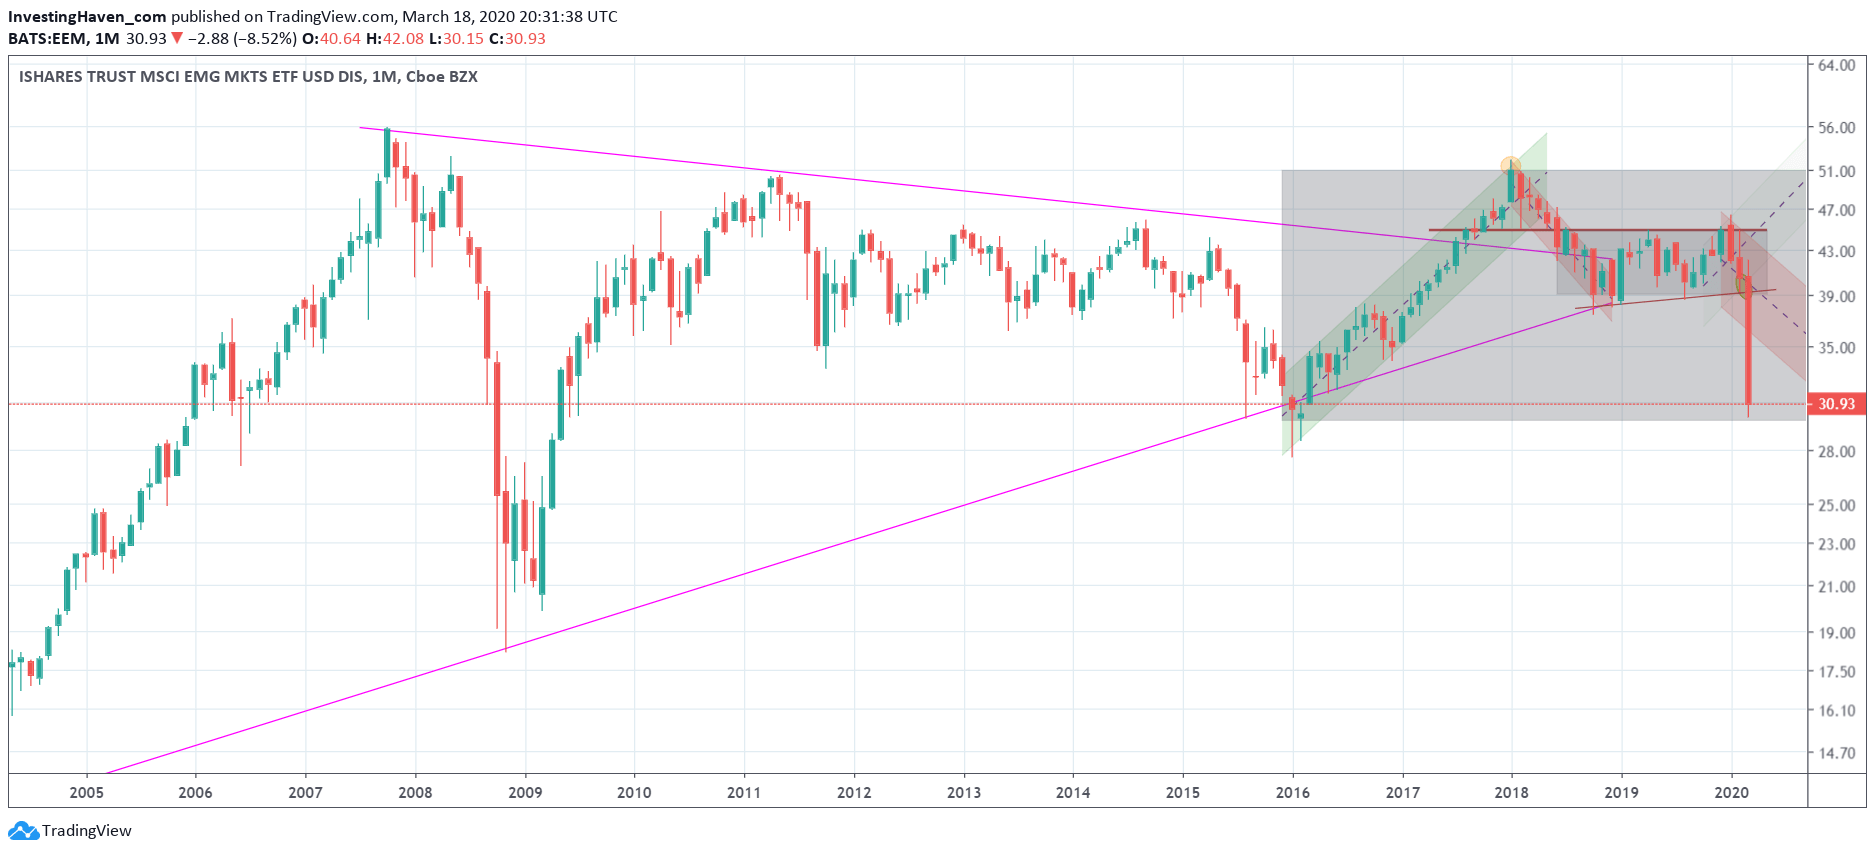
All we see nowadays in our long term charts is incredible observations. We wrote about the incredible test of the German DAX, incredible volatility charts, but also bargains like the one in First Majestic Silver and potentially (hopefully) in Microsoft. But what about emerging markets? Well, it seems that emerging markets as per the EEM ETF trades at a pivot point now: either it starts a wide consolidation or a 30% decline! Our emerging markets forecast may have to be revised, visibly.
The EEM ETF monthly chart is shown below.
The 2002 till 2007 uptrend was huge. The 2008 crash was epic. Since then emerging markets were in a wide consolidation between 28 and 50 points.
Interestingly, it looked like EEM ETF was ready to break out in January. The entire corona saga stopped this cold, and the monthly candle we see of this month is huge. It’s an 2008 style candle and decline.
With this we have now a test of this wide consolidation area in play. Make no mistake, this is a critical price level. If this does not hold the only support that comes next is at 20 points, the 2008 crash lows.
Let’s hope emerging markets don’t lose another 30 pct.


