Investing Haven
No Result
View All Result
Gold Silver Investing >>
CRYPTO INVESTING >>
  • 2025 Forecasts
    • 10 market predictions
    • Dow Jones forecast
    • S&P 500 forecast 2025
    • Nasdaq prediction 2025
    • Best altcoins to buy
    • Best crypto to buy now
    • Which crypto will explode
    • 15 crypto forecasts 2025
    • Which precious metal to buy
  • Silver
    • Silver prediction 2025 – 2030
    • Will silver exceed $30?
    • When will silver hit $50?
    • Can silver hit $100?
    • Silver shortage
    • 50-year silver chart
    • Silver bullish reversal
    • Silver seasonality charts
    • How to invest in silver
  • Gold
    • Gold prediction 2025 – 2030
    • Will gold set new ATH?
    • Will gold hit $3,000?
    • Can gold hit $10,000?
    • Gold chart 10 years
    • Gold chart 50 years
    • Gold chart 100 years
    • Gold silver ratio
    • Gold seasonality charts
  • Commodities
    • Coffee forecasts
    • Sugar forecasts
    • Nickel forecasts
    • Lithium investing
  • Crypto forecasts
    • BTC prediction 2025 – 2030
    • ETH prediction 2025 – 2030
    • SOL prediction 2025 – 2030
    • XRP prediction 2025 – 2030
    • XLM prediction 2025 – 2030
    • BNB prediction 2025 – 2030
    • ADA prediction 2025 – 2030
    • AVAX prediction 2025 – 2030
    • KAS prediction 2025 – 2030
    • NEAR prediction 2025 – 2030
    • BCH prediction 2025 – 2030
    • LINK prediction 2025 – 2030
    • DOT prediction 2025 – 2030
    • SUI prediction 2025 – 2030
    • ICP prediction 2025 – 2030
    • LTC prediction 2025 – 2026
    • STX prediction 2025 – 2030
    • DOGE prediction 2025 – 2030
    • SHIB prediction 2025 – 2030
    • PEPE prediction 2025 – 2030
    • FLOKI prediction 2025 – 2030
    • WIF prediction 2025 – 2030
    • ONDO prediction 2025 – 2030
  • News
    • Crypto news
    • Commodities
  • Login
Investing Haven
No Result
View All Result

Home » Markets & Stocks » Forecasting Markets: This Is How We’ll Know If Stocks Will Be Bullish vs. Bearish

Forecasting Markets: This Is How We’ll Know If Stocks Will Be Bullish vs. Bearish

Taki T. by Taki T.
April 10, 2022
in Markets & Stocks
leading indicators
1.9k
VIEWS
Share on FacebookShare on Twitter

One of the most fascinating things in markets is forecasting trends and price targets. It certainly is one of the most challenging things as the number of (pseudo) analysts and forecasters has grown exponentially in recent years. Moreover, with a plethora of charting tools it seems that forecasting is ‘easy peasy’, right? It’s quite the opposite, in fact. Anecdotal evidence comes from our highly accurate 2022 forecasts which were really not established by using features of popular tools.

Markets are adapting to this ‘new reality’ of its participants. In fact, the more analysts and interest the more challenging markets become.

More sophisticated techniques are required to get the analysis right. More importantly, patience is growing as one of the most important success factors. Not only is patience impossible to include in tools, it is the exact opposite: with more tools and a never-ending stream of financial content it is probably to most undervalued and hardest to obtain ‘value’ or ‘skill’ or ‘asset’ for investors.

As per Einstein: “Everything must be made as simple as possible, but not one bit simpler.”

The same applies to forecasting trends and price targets in markets.

While the number of ‘do it yourself’ tools have grown for analysts, they all come with an incredible amount of features. All this triggers analysis to become more complicated.

The truth of the matter is that markets are complex, but capital flows are not complex. They are there, and any forecasting methodology should be able to ‘capture’ them. It won’t work with technical indicators as those are lagging.

One of the angles that we apply, completely ignored by 99% of analysts, is timeline analysis. Yes, we have realized big successes with this and we’ll continue to do so! We won’t elaborate on this, consider it our IP.

Another angle is simply finding the market that is creating a dominant trend, and analyze that market as well as its leading indicator. How simple can things be, right. Sounds simple, apparently not so simple to execute.

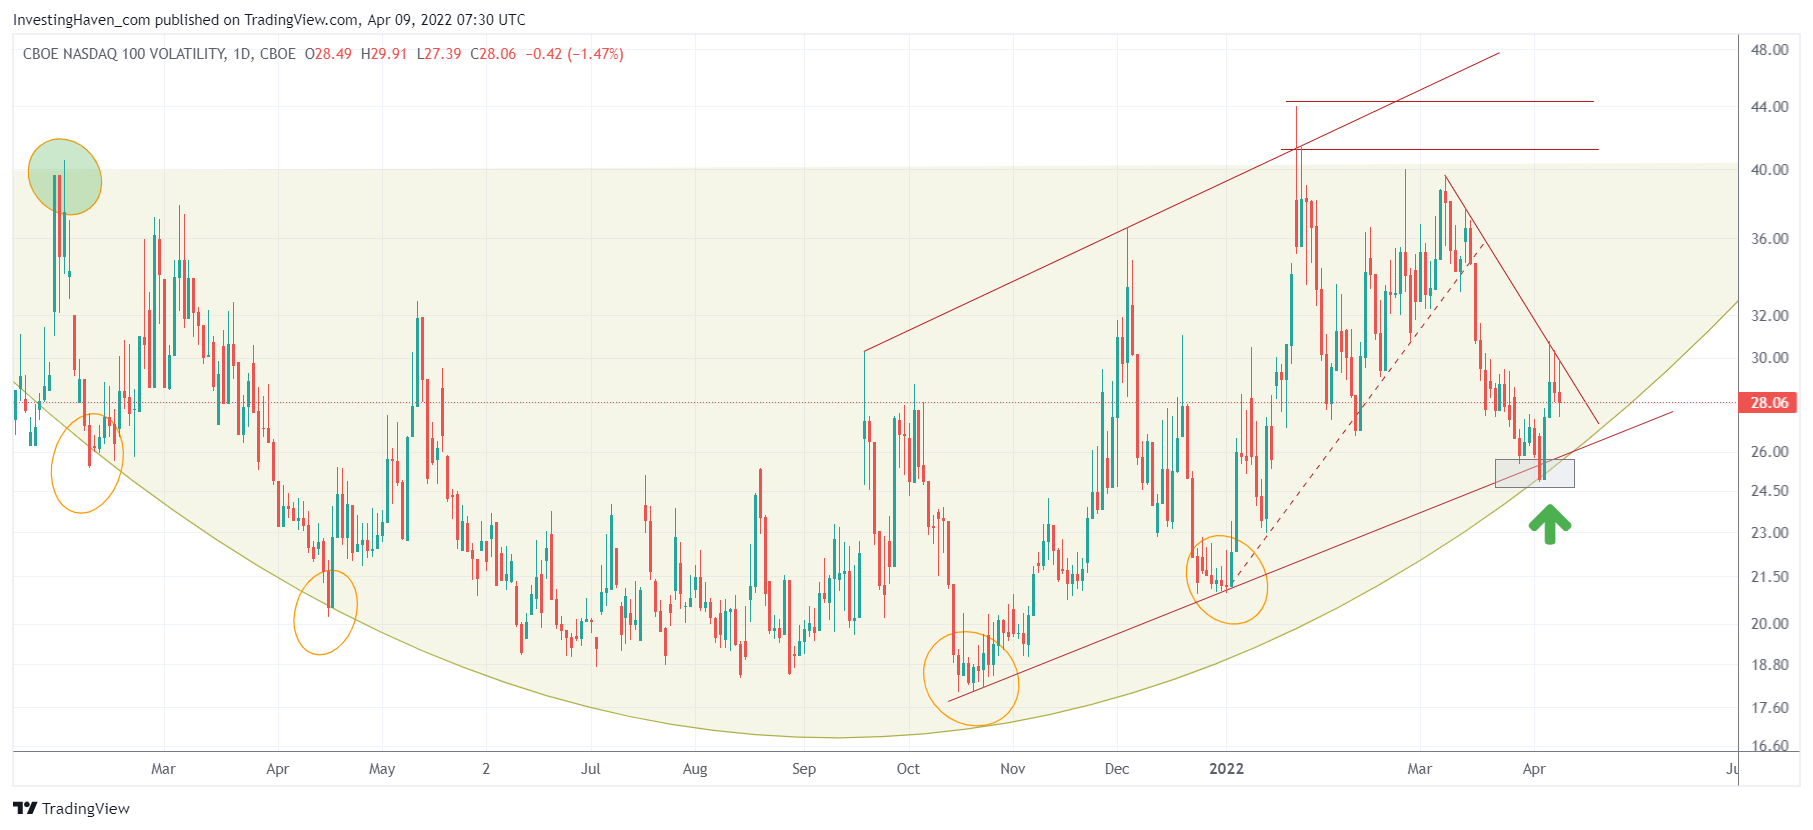
The dominant trend in stock markets since mid-November has been weakness in tech stocks. The leading indicator of the Nasdaq is its volatility chart. So, if you want to understand the trend going forward, you need to understand the intention of the Nasdaq and you do so based on a thorough understanding of the Nasdaq volatility chart.

Here is how it goes:

  • The Nasdaq volatility index is going through a long term bullish reversal which comes with bearish implications for the Nasdaq index.
  • A strongly rising trend started in November. A series of higher highs and higher lows was set in a perfect structure.
  • On February 27th, we explained in great detail in our premium services that the highs of the Nasdaq volatility index would predict the start of a real crash vs. the end of selling. The chart we featured to members was released one month later in the public domain How To Forecast The Nasdaq. Below is what the chart looks like today, but you should really pay attention to the ‘events’ on this chart end of Feb / early March.
  • Moreover, and equally important, on March 6h, we mentioned in Nasdaq: Is A Bounce Imminent that the timeline suggested an end of selling.

The timeline combined with a few specific price points on the Nasdaq volatility chart were able to help us (tremendously) understand direction of the market. We positioned ourselves accordingly.

So, what does all this mean for markets going forward? It is really simple. The falling trendline that originated in the first week of March is the driving force. Once this indicator clears the falling trendline to the upside (approx. around 30 points), it will introduce more selling in stocks. The only question becomes if volatility will end at the point where the breakdown on March 16th started (approx. around 35 points).

On the flipside, a bullish outcome in US markets will come with an invalidation of the 6 month rising trendline (currently also support of the rounded pattern), approximately around 26 points.

forecast - indicator


This article was originally posted on InvestingHaven.com


10-YEAR ANNIVERSARY OFFER: InvestingHaven.com celebrates 10 years. Temporarily, you can enjoy a discount on our premium gold/silver and crypto reports. Or you can become a VIP member. Go to our anniversary deals >>
Receive our weekly newsletter.

premium service SP-500 premium service trade alerts premium service crypto teaser 

No related posts.

Taki T.

Taki T.

Taki is a chart analyst who is passionate about unlocking unique insights out the chart. While the vast majority of analysts remain focused on price analysis, Taki starts with timeline analysis and adds price analysis to this. In doing so, he developed a unique methodology to find opportunities in financial markets, across assets and markets.

Connect with InvestingHaven

Receive top notch forecasts for free.

*We hate spam as you do.

Site Navigation

  • RSS Feed
  • About us
  • Advertising
  • Sponsored Content Policy
  • Mission 2026
  • Sitemap
  • Privacy & Disclaimer
  • Terms of Service
  • Contact Us
investing haven logo

Precious metals market analysis including gold and silver price predictions. Crypto market analysis including highly accurate BTC ETH SOL XRP forecasts.

Copyright © 2025 InvestingHaven

Login to your account below

Forgotten Password?

Fill the forms bellow to register

All fields are required. Log In

Retrieve your password

Please enter your username or email address to reset your password.

Log In

Receive top notch forecasts for free.

*We hate spam as you do.

No Result
View All Result
  • News
  • 2025 Forecasts
    • 10 market predictions
    • Dow Jones forecast 2025
    • S&P 500 forecast 2025
    • Nasdaq prediction 2025
    • Best crypto to buy now
    • Which crypto will explode
    • Best altcoins to buy
    • 15 crypto forecasts 2025
    • Which precious metal to buy
  • Silver articles
    • Silver prediction 2025 – 2030
    • Will silver exceed $30?
    • When will silver hit $50?
    • Can silver hit $100?
    • Silver shortage
    • 50-year silver chart
    • Silver bullish reversal
    • Silver seasonality charts
    • How to invest in silver
  • Gold
    • Gold prediction 2025 – 2030
    • Will gold set new ATH?
    • Will gold hit $3,000?
    • Can gold hit $10,000?
    • Gold chart 10 years
    • Gold chart 50 years
    • Gold chart 100 years
    • Gold silver ratio
    • Gold seasonality charts
  • Commodities
    • Sugar forecasts
    • Coffee forecasts
    • Nickel forecasts
    • Lithium investing
  • Crypto news
  • Crypto forecasts
    • BTC prediction 2025 – 2030
    • ETH prediction 2025 – 2030
    • SOL prediction 2025 – 2030
    • XRP prediction 2025 – 2030
    • XLM prediction 2025 – 2030
    • BNB prediction 2025 – 2030
    • ADA prediction 2025 – 2030
    • AVAX prediction 2025 – 2030
    • KAS prediction 2025 – 2030
    • NEAR prediction 2025 – 2030
    • BCH prediction 2025 – 2030
    • LINK prediction 2025 – 2030
    • DOT prediction 2025 – 2030
    • SUI prediction 2025 – 2030
    • ICP prediction 2025 – 2030
    • LTC prediction 2025 – 2026
    • STX prediction 2025 – 2030
    • DOGE prediction 2025 – 2030
    • SHIB prediction 2025 – 2030
    • PEPE prediction 2025 – 2030
    • FLOKI prediction 2025 – 2030
    • WIF prediction 2025 – 2030
    • ONDO prediction 2025 – 2030
  • Premium Crypto Alerts
  • Premium services

Copyright © 2025 InvestingHaven