As said earlier today we expect the gold price to ‘blast’ through all-time highs any time soon. Gold at ATH is something we predicted almost a year ago in our gold forecast for 2020 and 2021, soon to be updated with our latest-and-greatest 2021 forecast. What about gold miners, they were somehow struggling last week, is there more upside potential?
We take two different views to answer this question.
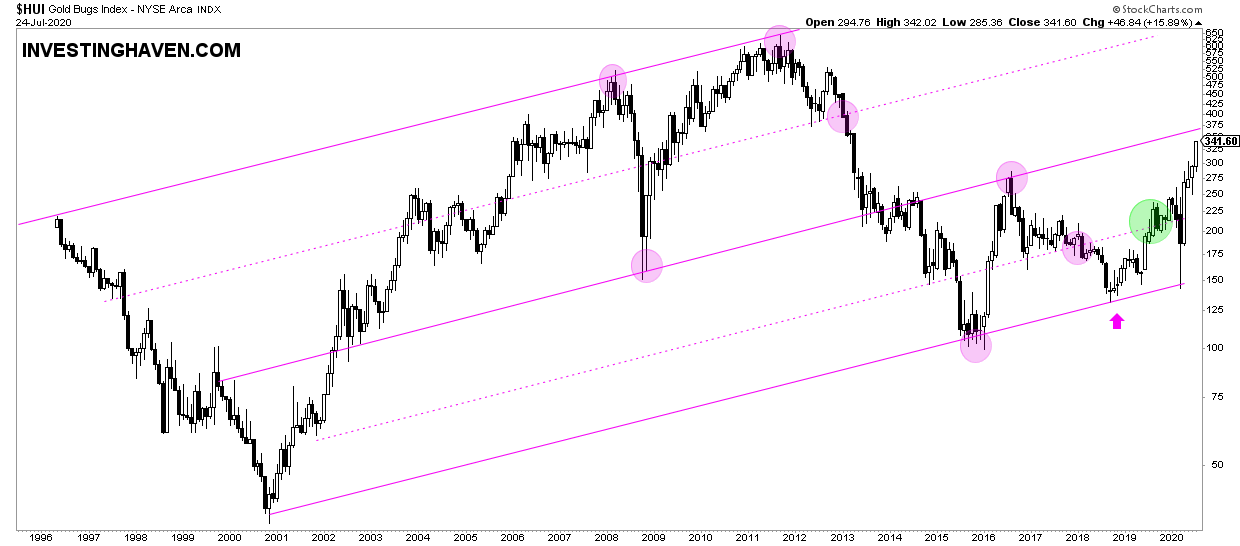
First, the gold miner index on the long term. The HUI index.
We see the very long term chart, monthly timeframe, which has a strongly rising uptrend. We call it a rising channel. Look how precise these trendlines have worked: the 2000 bottom connects the lows of 2015, 2016, 2018, 2020 (Corona crash lows).
The first next resistance level is 375 pionts, still +10% upside in this index, before we can expect a break. Once above 375 points there is hardly any resistance until 700 points. Pretty amazing, isn’t it?
Better take this from the long term, so a medium to long term investment, as opposed to trading gold miners in the very short term. Short term trades are ok on the gold or silver price, not miners.

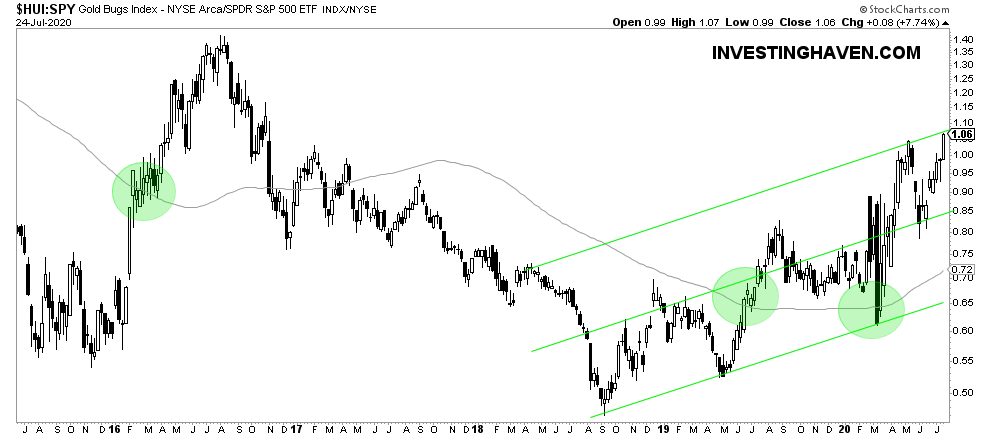
The other view is the HUI relative to the S&P 500. This is the HUI:SPY ratio, one we closely track as well.
We see a rising channel that is hitting sort of ‘resistance’. What does this imply?
- If gold miners and the S&P 500 will rise together, this ratio will stabilize within its rising channel.
- If the S&P 500 becomes weak, and miners move higher (because gold clearly wants to move higher) it will ‘blast’ higher.
- If gold miners need a break higher, which is not really expected given the first chart above, we may see a pause before moving strongly higher in a few weeks.
Whatever the short term outcome, medium term this market wants to go up, is the conclusion from both charts!


