Investing Haven
No Result
View All Result
Gold Silver Investing >>
CRYPTO INVESTING >>
  • 2025 Forecasts
    • 10 market predictions
    • Dow Jones forecast
    • S&P 500 forecast 2025
    • Nasdaq prediction 2025
    • Best altcoins to buy
    • Best crypto to buy now
    • Which crypto will explode
    • 15 crypto forecasts 2025
    • Which precious metal to buy
  • Silver
    • Silver prediction 2025 – 2030
    • Will silver exceed $30?
    • When will silver hit $50?
    • Can silver hit $100?
    • Silver shortage
    • 50-year silver chart
    • Silver bullish reversal
    • Silver seasonality charts
    • How to invest in silver
  • Gold
    • Gold prediction 2025 – 2030
    • Will gold set new ATH?
    • Will gold hit $3,000?
    • Can gold hit $10,000?
    • Gold chart 10 years
    • Gold chart 50 years
    • Gold chart 100 years
    • Gold silver ratio
    • Gold seasonality charts
  • Commodities
    • Coffee forecasts
    • Sugar forecasts
    • Nickel forecasts
    • Lithium investing
  • Crypto forecasts
    • BTC prediction 2025 – 2030
    • ETH prediction 2025 – 2030
    • SOL prediction 2025 – 2030
    • XRP prediction 2025 – 2030
    • XLM prediction 2025 – 2030
    • BNB prediction 2025 – 2030
    • ADA prediction 2025 – 2030
    • AVAX prediction 2025 – 2030
    • KAS prediction 2025 – 2030
    • NEAR prediction 2025 – 2030
    • BCH prediction 2025 – 2030
    • LINK prediction 2025 – 2030
    • DOT prediction 2025 – 2030
    • SUI prediction 2025 – 2030
    • ICP prediction 2025 – 2030
    • LTC prediction 2025 – 2026
    • STX prediction 2025 – 2030
    • DOGE prediction 2025 – 2030
    • SHIB prediction 2025 – 2030
    • PEPE prediction 2025 – 2030
    • FLOKI prediction 2025 – 2030
    • WIF prediction 2025 – 2030
    • ONDO prediction 2025 – 2030
  • News
    • Crypto news
    • Commodities
  • Login
Investing Haven
No Result
View All Result

Home » Markets & Stocks » How To Predict Whether Market Turmoil Is Underway

How To Predict Whether Market Turmoil Is Underway

Taki T. by Taki T.
November 28, 2023
in Markets & Stocks
crash stocks
2.3k
VIEWS
Share on FacebookShare on Twitter

Hardly anyone can escape the stock market crash fear. It is everywhere especially on the internet. That’s why we always warn to stay factual, and master emotions when investing. It is a solid chart based method that will not only help neutralize fear but it will also help predict future trends. This article focuses on the question how to predict whether market turmoil is underway.

As an illustration of how easy it is to get caught up on the ‘stock market crash’ saga below is a subset of crash articles that appeared in the last week:

  • ‘Obscenely overvalued’: Stocks are far more fragile than most people realize — and one expert says traders are making the same mistake they did before the last 2 crashes (Business Insider)
  • BMO Warns US Stock Market Could Crash to ‘Ugly’ December Lows (CCN)
  • Protect Your Retirement Against Stock Market Crashes (Forbes)
  • 1929 Stock Market Crash: Did Panicked Investors Really Jump From Windows? (History.com)
  • 10 years ago this week, the market hit the climactic bottom of the Great Recession (CNBC)

Scary, right?

That’s the problem. Fear is so misleading.

The antitode against fear is a chartlist with the right charts as per a method that has stood the test of time.

How To Predict Whether A Stock Market Crash Is Underway

InvestingHaven’s method looks at important market turning points based on this principle, and we said so in our investing tips for successful investors:

All major moves in markets, especially market crashes, start with major turning points in credit and currency markets. That’s why 10 and 20 year rates, as well as leading currency pairs, have the most influence on all other markets, including stock markets around the globe.

Below we revise the most important currency and credit market indicators: the 10-year Yield chart as well as the Euro chart. We also explain how to read those charts when attempting to forecast a stock market crash!

10-year yields

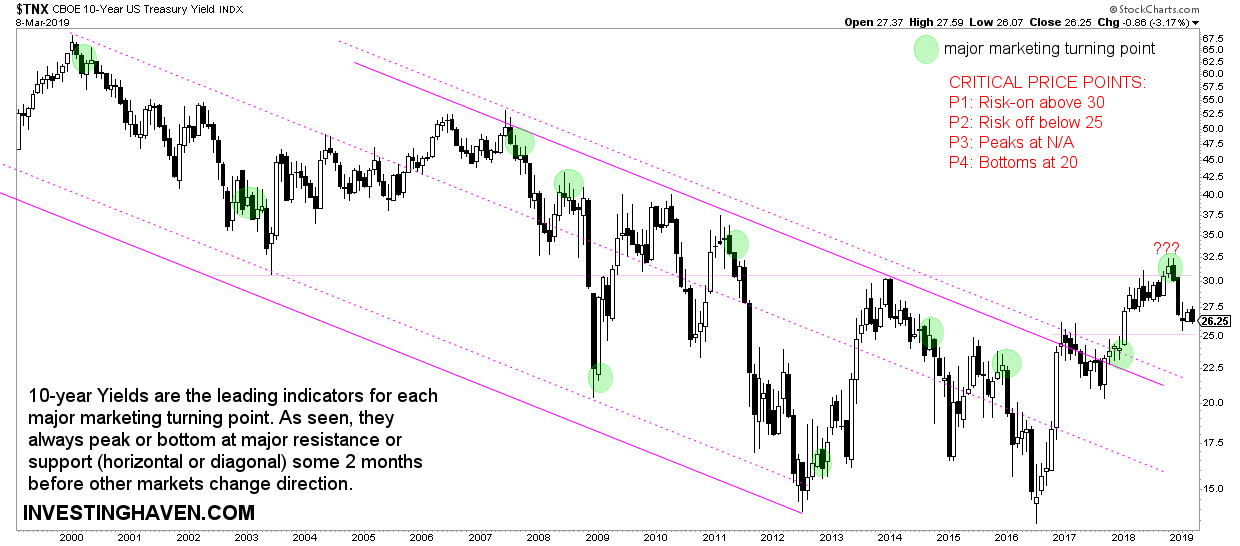
What we are looking for as a major red flag is a fast decline of yields when breaking an important chart pattern. For instance, moving very fast below 22.5 points, the upper line of the falling channel.

The joker on this chart is the recent breakout above the channel. This may suggest that we entered a new era in the bond and yield market.

Between 25 and 30 points this indicator is neutral, and does not forecast any turmoil.
predict market turmoil yields

The Euro

The most important currency chart is the Euro. It should be read together with the yields, see above.

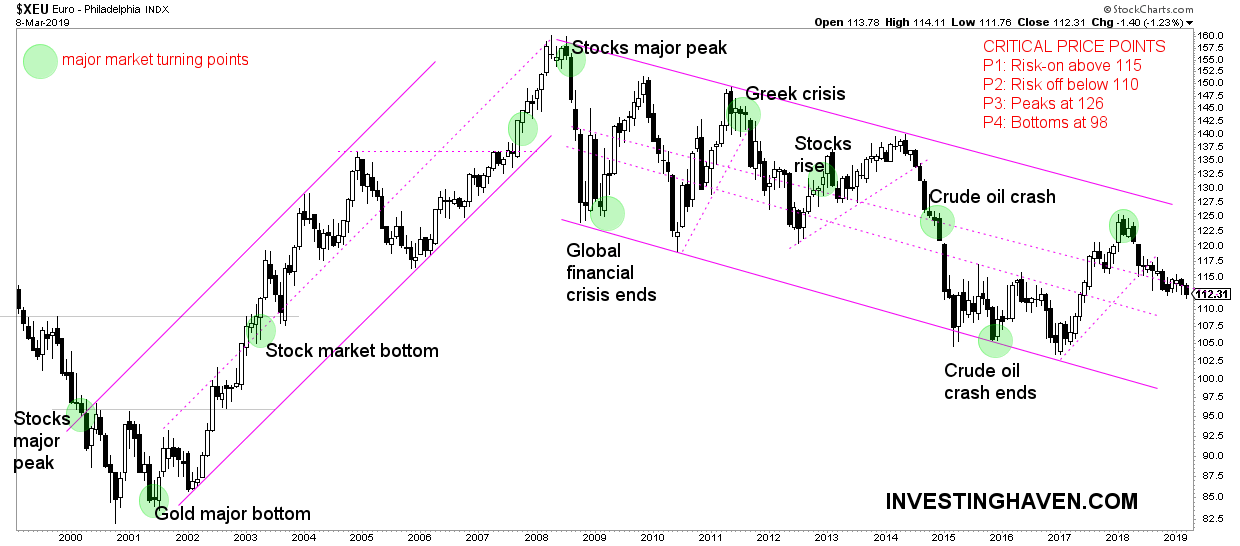
The Euro chart, similarly, should show an acceleration of a decline when breaking down through an important price level or after touching secular resistance. None of this is happening right now, which does not mean it cannot happen in the future.

For now, no early sign of a stock market crash whatsoever.

A soft decline to the support area in the 105 to 110 level is not a problem, a very fast decline would be a different story.
predict market turmoil euro

How does this influence stock markets?

The whole point about our intermarket methodology is that leading indicators in the currency and credit markets should be read together with important chart pattern changes in stocks, commodities or inflation readings.

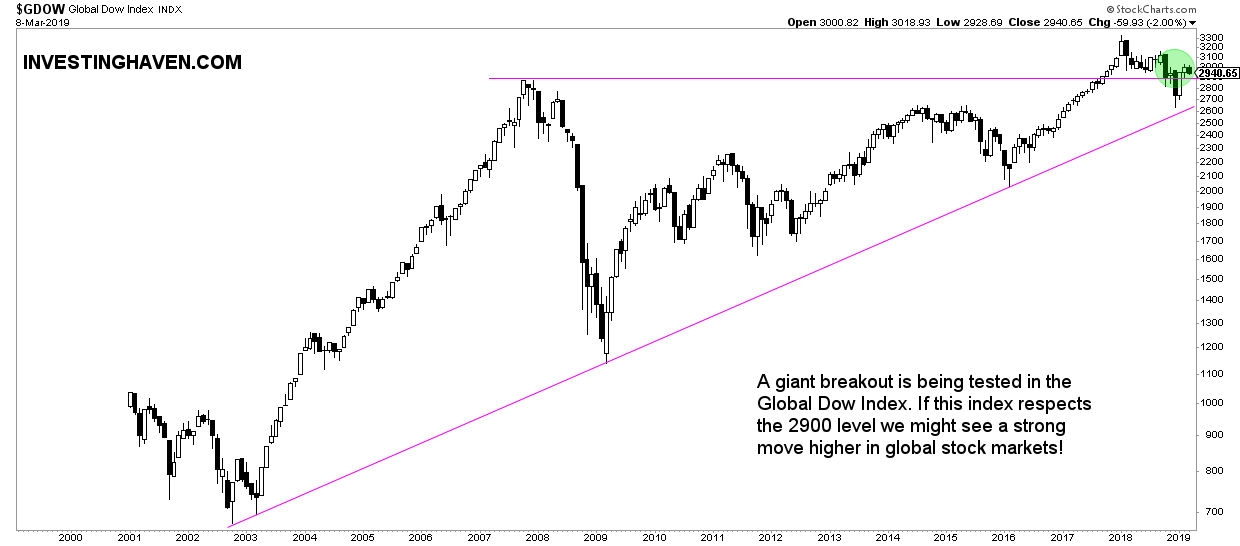
Let’s take the global Dow as an example. This instrument is testing a major breakout. Assume this will fall through its triangle, below 2650 points in conjunction with fast falling yields and Euro, it would forecast serious trouble ahead.

None of this is happening right now. No signs of a stock market crash coming!
predict market turmoil global dow

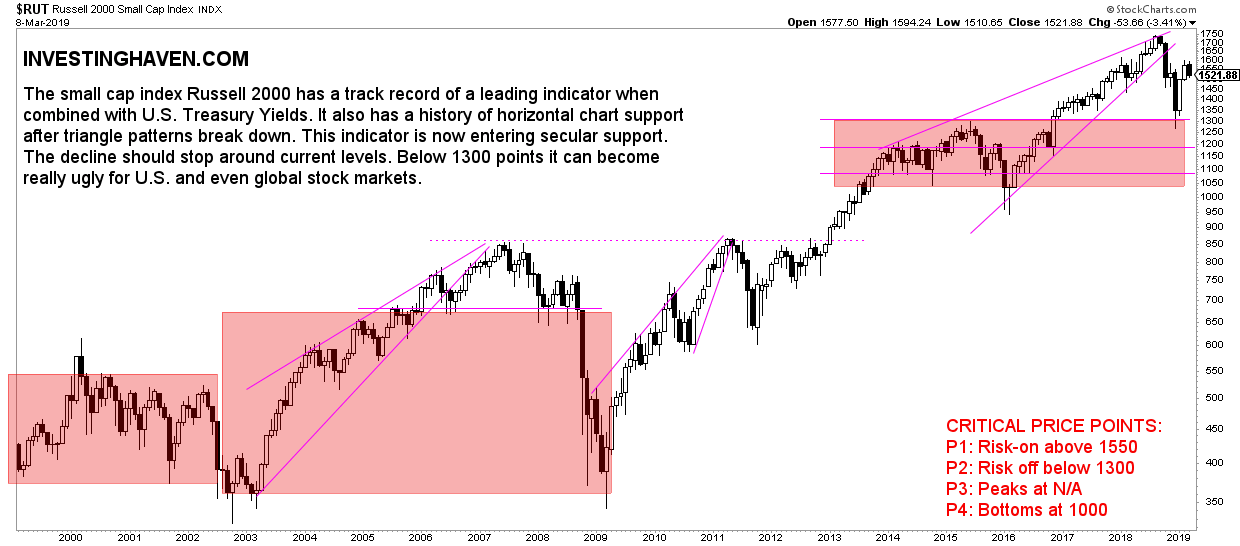
Similarly, if the Russell 2000, our leading indicator for U.S. stock markets, falls below 1300 points after the Euro and 10-year yields are decling fast with a breakdown on their chart, it would forecast a stock market crash is underway!

Again, nothing like that is visible in the chart today.
predict market turmoil russell 2000

10-YEAR ANNIVERSARY OFFER: InvestingHaven.com celebrates 10 years. Temporarily, you can enjoy a discount on our premium gold/silver and crypto reports. Or you can become a VIP member. Go to our anniversary deals >>
Receive our weekly newsletter.

premium service SP-500 premium service trade alerts premium service crypto teaser 

No related posts.

Tags: EURGDOWRUSSELL2000TNX
Taki T.

Taki T.

Taki is a chart analyst who is passionate about unlocking unique insights out the chart. While the vast majority of analysts remain focused on price analysis, Taki starts with timeline analysis and adds price analysis to this. In doing so, he developed a unique methodology to find opportunities in financial markets, across assets and markets.

Connect with InvestingHaven

Receive top notch forecasts for free.

*We hate spam as you do.

Site Navigation

  • RSS Feed
  • About us
  • Advertising
  • Sponsored Content Policy
  • Mission 2026
  • Sitemap
  • Privacy & Disclaimer
  • Terms of Service
  • Contact Us
investing haven logo

Precious metals market analysis including gold and silver price predictions. Crypto market analysis including highly accurate BTC ETH SOL XRP forecasts.

Copyright © 2025 InvestingHaven

Login to your account below

Forgotten Password?

Fill the forms bellow to register

All fields are required. Log In

Retrieve your password

Please enter your username or email address to reset your password.

Log In

Receive top notch forecasts for free.

*We hate spam as you do.

No Result
View All Result
  • News
  • 2025 Forecasts
    • 10 market predictions
    • Dow Jones forecast 2025
    • S&P 500 forecast 2025
    • Nasdaq prediction 2025
    • Best crypto to buy now
    • Which crypto will explode
    • Best altcoins to buy
    • 15 crypto forecasts 2025
    • Which precious metal to buy
  • Silver articles
    • Silver prediction 2025 – 2030
    • Will silver exceed $30?
    • When will silver hit $50?
    • Can silver hit $100?
    • Silver shortage
    • 50-year silver chart
    • Silver bullish reversal
    • Silver seasonality charts
    • How to invest in silver
  • Gold
    • Gold prediction 2025 – 2030
    • Will gold set new ATH?
    • Will gold hit $3,000?
    • Can gold hit $10,000?
    • Gold chart 10 years
    • Gold chart 50 years
    • Gold chart 100 years
    • Gold silver ratio
    • Gold seasonality charts
  • Commodities
    • Sugar forecasts
    • Coffee forecasts
    • Nickel forecasts
    • Lithium investing
  • Crypto news
  • Crypto forecasts
    • BTC prediction 2025 – 2030
    • ETH prediction 2025 – 2030
    • SOL prediction 2025 – 2030
    • XRP prediction 2025 – 2030
    • XLM prediction 2025 – 2030
    • BNB prediction 2025 – 2030
    • ADA prediction 2025 – 2030
    • AVAX prediction 2025 – 2030
    • KAS prediction 2025 – 2030
    • NEAR prediction 2025 – 2030
    • BCH prediction 2025 – 2030
    • LINK prediction 2025 – 2030
    • DOT prediction 2025 – 2030
    • SUI prediction 2025 – 2030
    • ICP prediction 2025 – 2030
    • LTC prediction 2025 – 2026
    • STX prediction 2025 – 2030
    • DOGE prediction 2025 – 2030
    • SHIB prediction 2025 – 2030
    • PEPE prediction 2025 – 2030
    • FLOKI prediction 2025 – 2030
    • WIF prediction 2025 – 2030
    • ONDO prediction 2025 – 2030
  • Premium Crypto Alerts
  • Premium services

Copyright © 2025 InvestingHaven