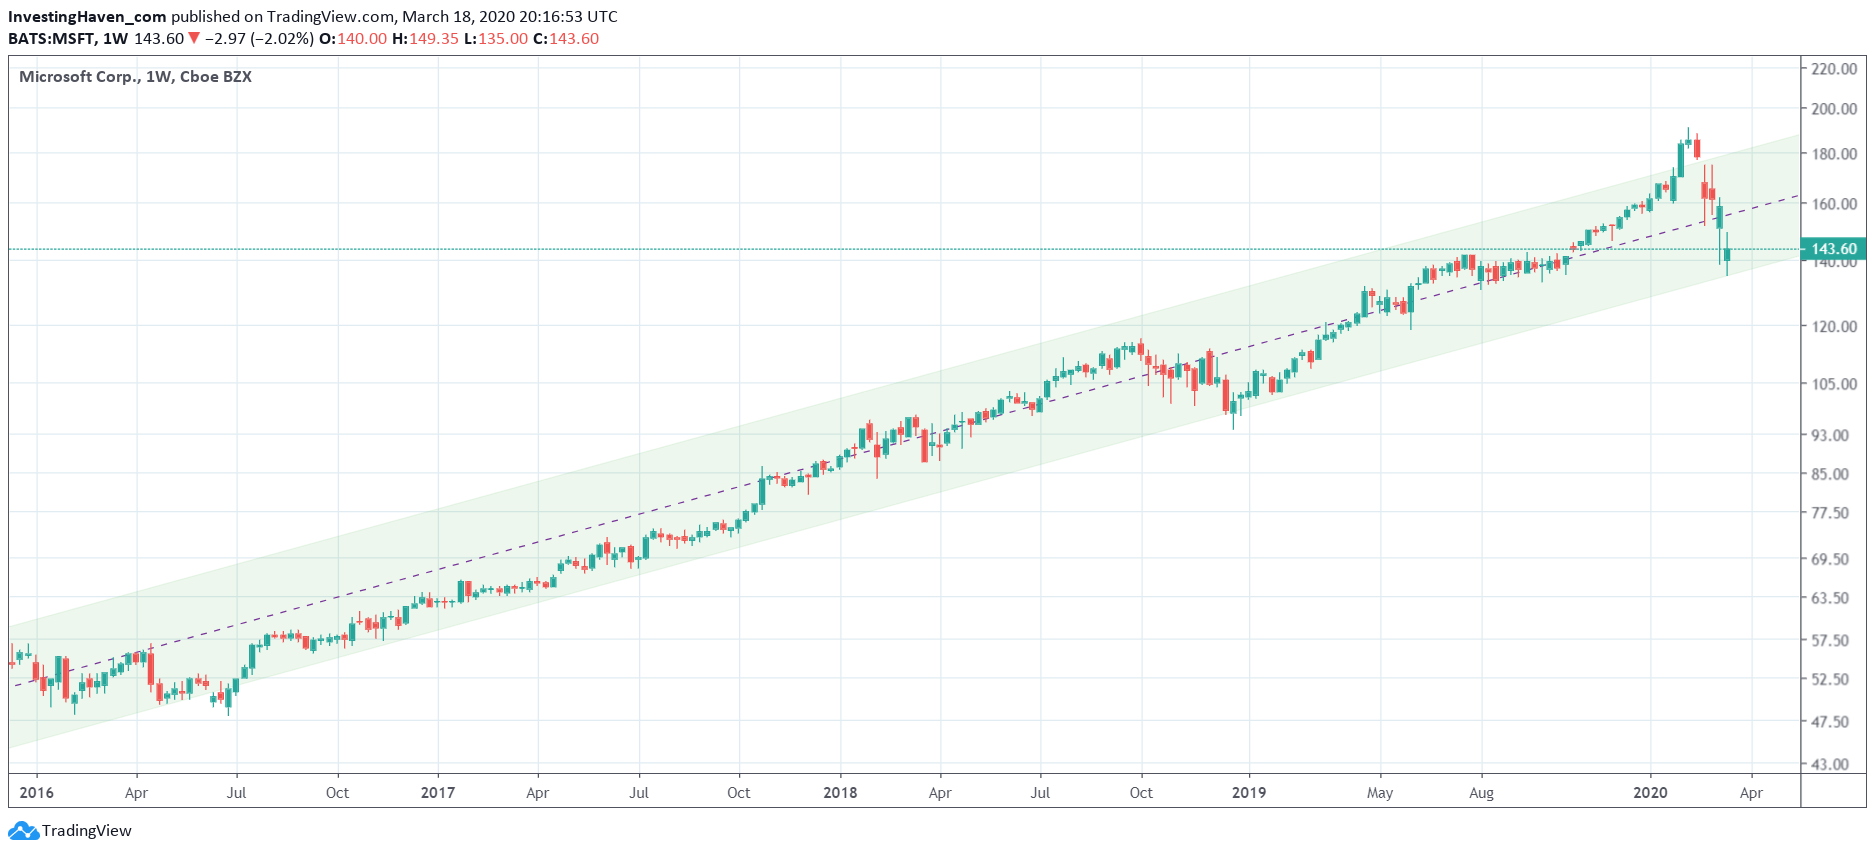
Microsoft trading at 100 USD? Who would even ‘dare’ talking about this idea a month ago? In all fairness we did not think about it neither. But it’s not the worst case scenario. Not saying it will, just saying it might happen. When? If current support does not hold. If we have another Black Thursday for instance.
The Microsoft chart is the type of ‘incredible chart’ for 2 reasons.
First of all, it is a long term momentum chart. Look at how beautiful its chart set up is. From the left bottom of the screen to the right top.
More importantly though is the recent decline that brought Microsoft from 200 USD to 140 USD (today). That’s in 6 weeks time. So fast? Yes, historically fast.
Microsoft witnessed this week its largest one day decline since the dot com bubble sell off in 2000.
For now it looks like this is a regular test of support. Buy the dip? Potentially yes. But this support level better does not break. Visibly, a breakdown from current levels does not have a lot of chart support until the 100 USD area.
Given that Microsoft is such an important stock in many (retirement) funds we better hope Microsoft does not close below 140 USD on the weekly chart for 3 consecutive weeks!

Anything is possible in current market conditions. Markets fell between 32 and 42 pct in the last 6 weeks, so why not another 10 to 20 pct? This is a time to stay safe, physically as well as financially. So protection comes first, and that’s exactly how we handle our short term trade portfolio as well as our medium term Momentum Investing portfolio.


