
What is InvestingHaven’s inflation forecast for 2019? Which assets might do well (or not) if inflation would rise in 2019? Is this inflation forecast for 2019 set in stone, which indicators to watch as time passes?
These questions are the subject of this article which tries to understand, based on current market conditions, if the inflation forecast for 2019 suggests higher or lower inflation.
This article looks at 5 reliable indicators in a very ‘pragmatic’ way. It is not meant to be a deep macro economic analysis.
Why an inflation forecast for 2019?
An inflation forecast for 2019, and adjusting if and when needed as time progresses, is important because it can keep your portfolio on par with market trends.
If the inflation forecast for 2019 outlined below comes true then it becomes imperative to sufficient inflation sensitive assets in your portfolio in 2019. Think of the commodities space in which some specific commodities will likely outperform.
We already start seeing signs of the uranium market moving (strongly) higher, signs of selling exhaustion in gold and silver with early signs of a new bull market in precious metals, and so on.
Note, however, is it not easy to do an inflation forecast for 2019 because inflation is (1) a concept that can have many interpretations (2) there are several indicators to follow (it is not one single data point that determines rising or falling inflation).
Inflation forecast for 2019: empirical evidence
Prices for a lot of things in everyday life are going up. Especially CEOs are flashing a warning about this. The CEO of Coca Cola, which seems very well positioned to get these early signs, is one of them. That’s because of transportation costs as well as prices of ingredients.
There is more evidence of consumer price inflation. In the consumer space many product prices have increased in recent 12 months. A McDonalds Big Mac went up 4.7% against a year ago, Starbucks rose their price of a freshly brewed coffee with 8.9%, one of the popular Domino’s pizza went up 5.9%.
This interview suggests that the inflation trend is towards the 2% that the U.S. Fed, and other central bankers, are aiming for.
Our view is that CEOs of leading companies, combined with other empirical evidence that was given in this video, seems a good anecdotal indicator to us. We consider this ’empirical evidence’ for rising consumer prices which is one inflation indicator.
Inflation forecast for 2019: gold vs inflation indicator
The correlation between precious metals prices and inflation is said to be high. While we are not saying it is a wrong statement or assumption, we don’t see this correlation happening in 100% of cases.
That’s why we must warn readers to avoid using the price of gold as the one and only inflation indicator. As said above multiple inflation indicators must be considered simultaneously.
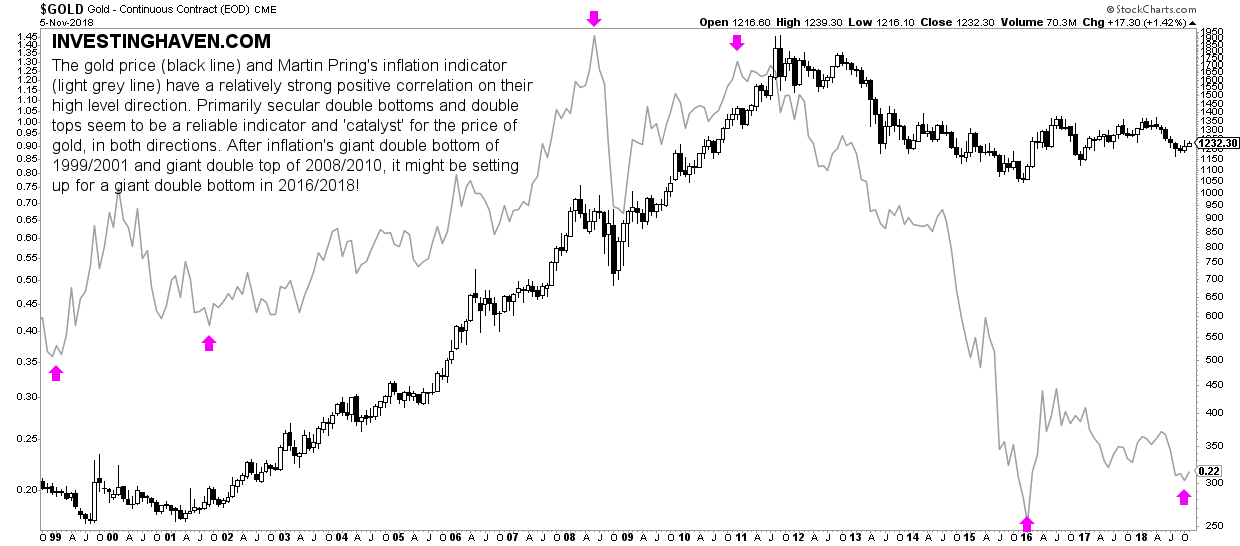
Below we look at the gold price overlaid by Martin Pring’s inflation indicator. This is the key finding from this chart:
The gold price (black line) and the inflation indicator (light grey line) have a relatively strong positive correlation on their high level direction. Primarily secular double bottoms and double tops seem to be a reliable indicator and ‘catalyst’ for precious metals prices, in both directions. After inflation’s giant double bottom of 1999/2001 and giant double top of 2008/2010, it might be setting up for a giant double bottom in 2016/2018!
It is this last sentence that is key: “After inflation’s giant double bottom of 1999/2001 and giant double top of 2008/2010, it might be setting up for a giant double bottom in 2016/2018.”
The chart indicates the major double bottom in 1999/2001 (with a higher low) and the major double top in 2008/2010 (with a major lower high). In a somehow similar fashion the 2016 major bottom may be a higher low against the 2018 bottom.
In other words, this chart suggests that (1) the high level direction of inflation and gold are correlated (2) inflation and the price of gold both suggest they will trend higher in 2019.
Key levels to watch: Martin Pring’s inflation indicator above 0.20 suggests ‘inflation is in the air’ while above 0.25 suggests rising inflation.
Inflation forecast for 2019: inflation expectations indicator
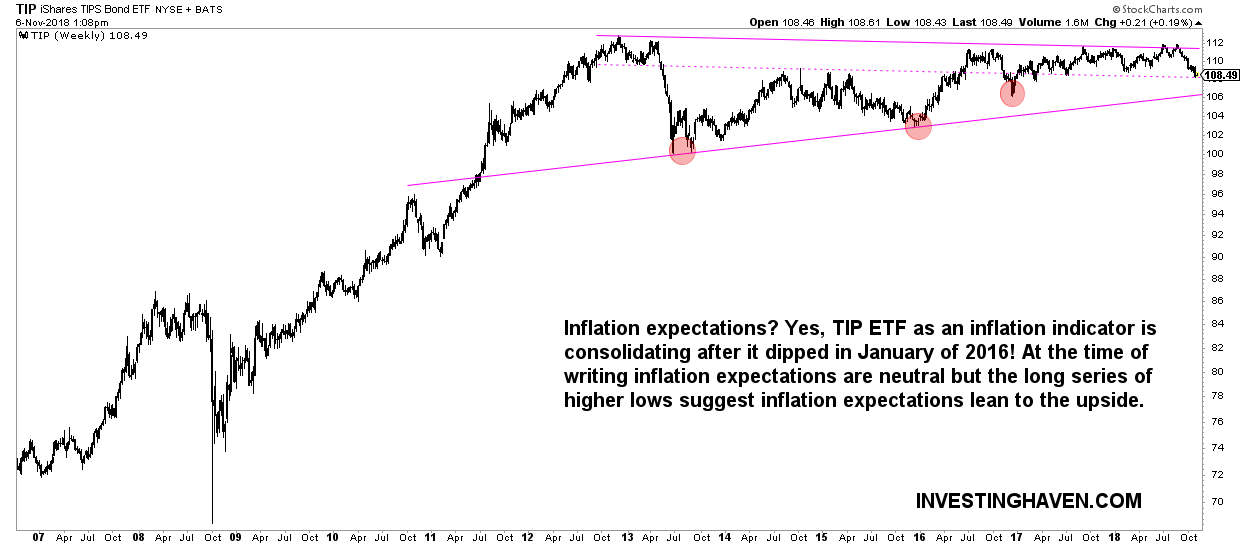
Another indicator which deserves following to understand if inflation is on the rise is the inflation indicator TIP ETF. It is an investment instrument which reflects rising inflation.
TIP ETF was rising strongly until 2012. Since then it trades in a giant triangle with, primarily, a series of higher lows (annotated with the small red circles on below chart).
What this chart setup suggests is that the odds favor rising inflation even if this indicator continues to consolidate. Its rising pattern is the high level direction that is important.
Key levels to watch: above 106 points suggests ‘inflation is in the air’, above 112 is a clearly rising inflation trend.
Commodities sensitive currency as an inflation indicator
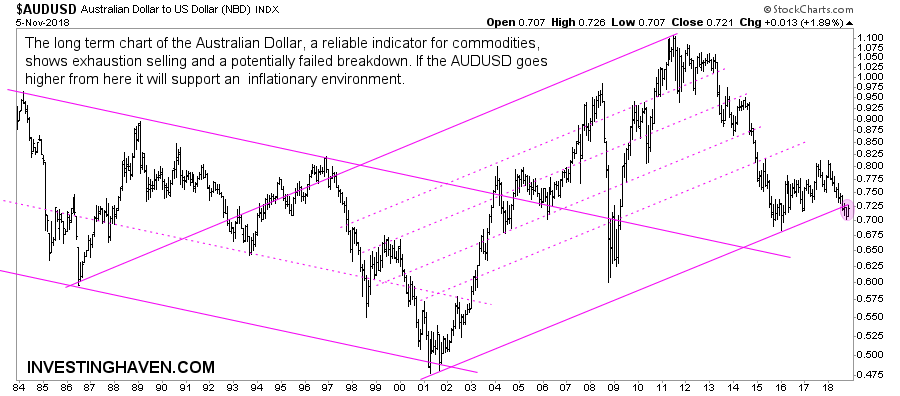
In the currency space it is the AUDUSD pair that is a reliable indicator for commodity prices. Hence, we can consider this an inflation indicator.
Here, as well, it is the high level direction that matters, not specific values.
It is easy to identify the pattern(s) on this long term AUDUSD chart. What is important to monitor is if the AUDUSD started a failed breakdown recently. If the AUDUSD gets back in its rising channel it will be inflation friendly, while if it sets a higher high against the readings early this year it will suggest rising inflation. It really is that easy.
Key levels to watch: above 0.725 suggests ‘inflation is in the air’ while above 0.825 suggests rising inflation.
Hourly wage increase as an inflation indicator
Hourly wages, especially in the U.S., can help indicate if inflation is stimulated. Especially the hourly earnings year-on-year change can suggest if employees earn more in order to spend more.
Note that this we consider this more of a secondary indicator, still one that adds value if it confirms (or diverges) from the above mentioned indicators.
Visibly, this indicator confirms the ones we listed above. No divergence. Mildly rising inflation is what this chart suggests.

Alternative inflation indicator
As an additional check we look at the alternative inflation indicator which is compiled by Shadowstats. It challenges the official government data.
Essentially, in terms of the high level direction, there is no new insight we derive from this indicator. Even if the absolute values diverge the trend is very similar!
In sum, we have checked several inflation indicators in this article, and all suggest as a base case mildly rising inflation and, potentially, strongly rising inflation. The key levels to watch for rising inflation: Martin Pring’s inflation indicator above 0.20 suggests ‘inflation is in the air’ while above 0.25 suggests rising inflation, TIP ETF above 106 points suggests ‘inflation is in the air’ while above 112 is a clearly rising inflation trend, AUDUSD above 0.725 suggests ‘inflation is in the air’ while above 0.825 suggests rising inflation.
How to play this? Very simple, if this mildly inflationary climate continues then we strongly recommend looking at commodity groups, specifically looking for a breakout. For instance, uranium may be breaking out, the price of silver is set to break out, and so on. That’s the right way to play this.


