Investing Haven
No Result
View All Result
Gold Silver Investing >>
CRYPTO INVESTING >>
  • 2025 Forecasts
    • 10 market predictions
    • Dow Jones forecast
    • S&P 500 forecast 2025
    • Nasdaq prediction 2025
    • Best altcoins to buy
    • Best crypto to buy now
    • Which crypto will explode
    • 15 crypto forecasts 2025
    • Which precious metal to buy
  • Silver
    • Silver prediction 2025 – 2030
    • Will silver exceed $30?
    • When will silver hit $50?
    • Can silver hit $100?
    • Silver shortage
    • 50-year silver chart
    • Silver bullish reversal
    • Silver seasonality charts
    • How to invest in silver
  • Gold
    • Gold prediction 2025 – 2030
    • Will gold set new ATH?
    • Will gold hit $3,000?
    • Can gold hit $10,000?
    • Gold chart 10 years
    • Gold chart 50 years
    • Gold chart 100 years
    • Gold silver ratio
    • Gold seasonality charts
  • Commodities
    • Coffee forecasts
    • Sugar forecasts
    • Nickel forecasts
    • Lithium investing
  • Crypto forecasts
    • BTC prediction 2025 – 2030
    • ETH prediction 2025 – 2030
    • SOL prediction 2025 – 2030
    • XRP prediction 2025 – 2030
    • XLM prediction 2025 – 2030
    • BNB prediction 2025 – 2030
    • ADA prediction 2025 – 2030
    • AVAX prediction 2025 – 2030
    • KAS prediction 2025 – 2030
    • NEAR prediction 2025 – 2030
    • BCH prediction 2025 – 2030
    • LINK prediction 2025 – 2030
    • DOT prediction 2025 – 2030
    • SUI prediction 2025 – 2030
    • ICP prediction 2025 – 2030
    • LTC prediction 2025 – 2026
    • STX prediction 2025 – 2030
    • DOGE prediction 2025 – 2030
    • SHIB prediction 2025 – 2030
    • PEPE prediction 2025 – 2030
    • FLOKI prediction 2025 – 2030
    • WIF prediction 2025 – 2030
    • ONDO prediction 2025 – 2030
  • News
    • Crypto news
    • Commodities
  • Login
Investing Haven
No Result
View All Result

Home » Markets & Stocks » InvestingHaven’s Market Pulse Following The FOMC Meeting

InvestingHaven’s Market Pulse Following The FOMC Meeting

Find out how Interest rates, bonds, Silver, USD, CRB, Dow Jones Industrial and Transportation are behaving after a historical rate hike today.

Taki T. by Taki T.
June 16, 2022
in Markets & Stocks
markets
1.9k
VIEWS
Share on FacebookShare on Twitter

All eyes were on the federal reserve announcement this week. Word of the day: Historical.

  • We have inflation hitting levels not seen since the early eighties, 1981 to be precise.
  • We have a 75bps rate hike announcement. The last time the fed increased by that much was in 1994.

Right after the announcement, the stock market seemed to recover and even precious metals seemed to catch a bid. It looks like the market had already priced in the hike and is moving higher as the fed chose to take a severe measure to tame inflation. But is that really the case? Will the US stock market continue to move higher from here? Will this rate hike actually succeed in reducing inflation?

Let’s start by looking into the price action of the primary indicators to have a pulse on the market after the FOMC meeting today.

Treasury Rates Following The FOMC Meeting Today

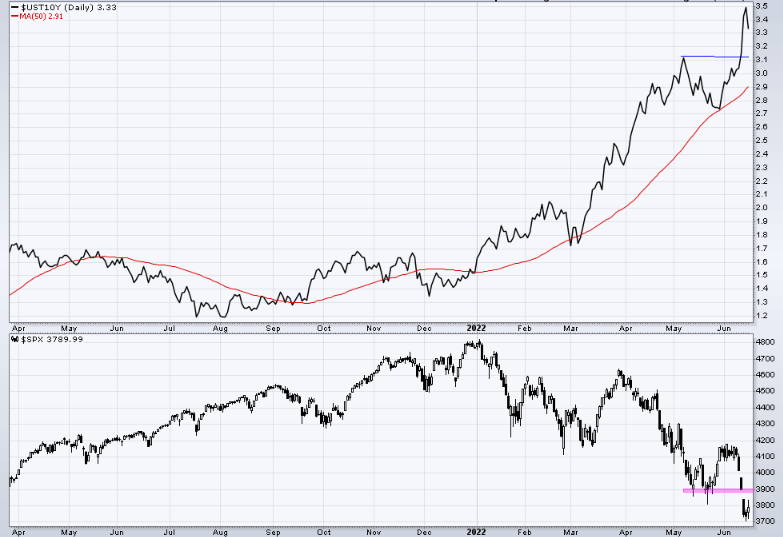
Until yesterday, Treasury rates kept a steep push to the upside as seen in the chart below. However, the price started rolling over at the open.

Now when looking at the chart below, we see the following:

The Treasury rates clearly broke out and faced resistance at 3.5% while the SPX started what looks like a reversal.

However, none of these 2 moves are confirmed. For treasuries, we need to see the 3.15 level back tested successfully. For the $SPX, the price needs to cross and hold above 3900.

It is still possible for the 3.15 support area in treasuries to fail and also very likely that the $SPX gets rejected in the 3900 to 4000 area.

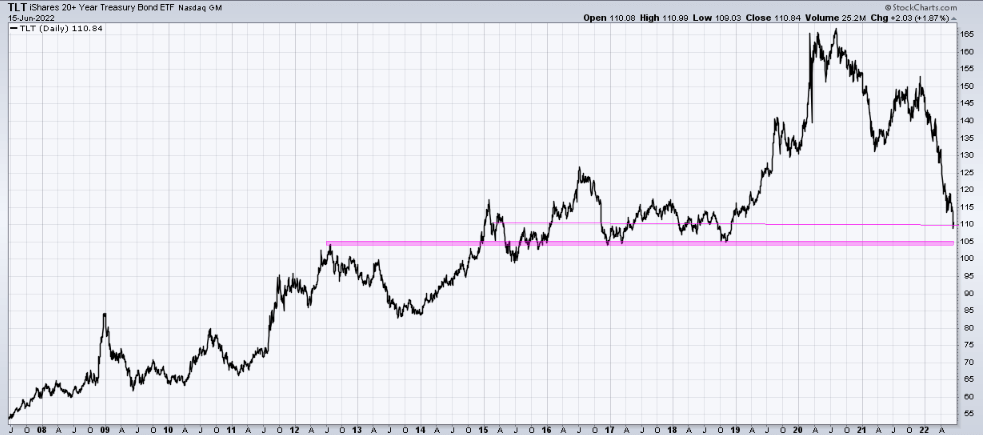
The long term chart below shows how the real breakout for interest rates may not have happened yet. There is clearly a lot of resistance in the 3.4 to 4 area.

The path of the least resistance here seems to be to the downside which should benefit the stock market.

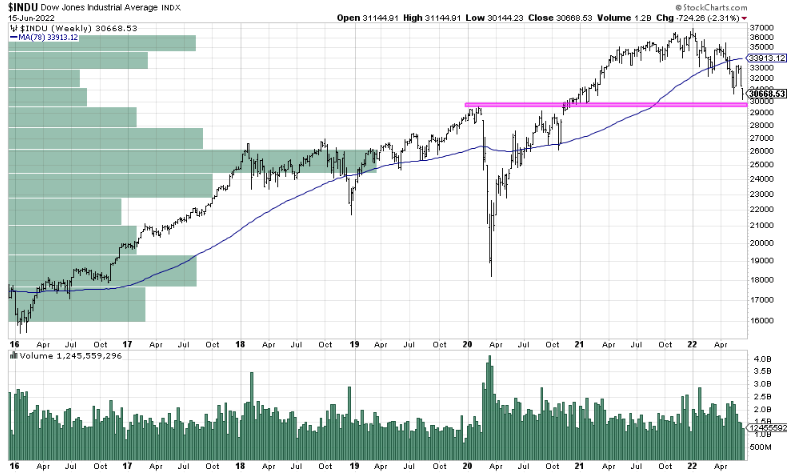
Interesting enough, the Dow Jones industrial seems to be around an important support area:

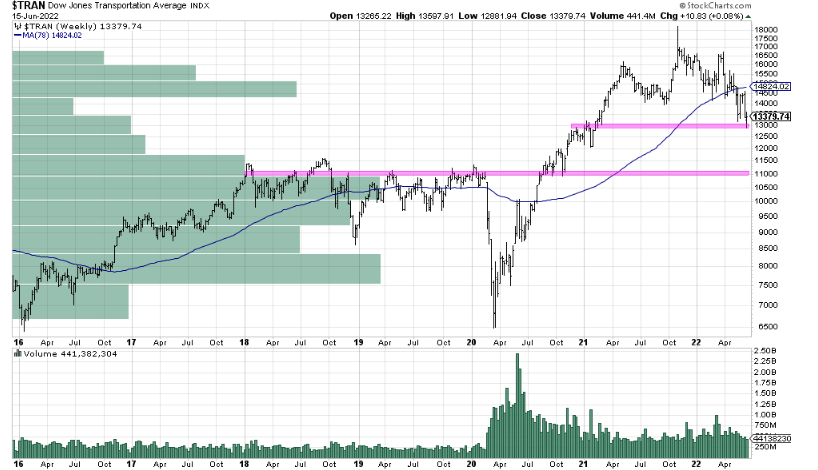
Same thing could be said about the Dow Jones transportation which seems to confirm.

Bonds broke down after a massive head and shoulders. However, they are in a major support area and the target price for a head and shoulders break down was reached. It doesn’t mean it can’t go lower but no trader in their right mind would enter a short position here.

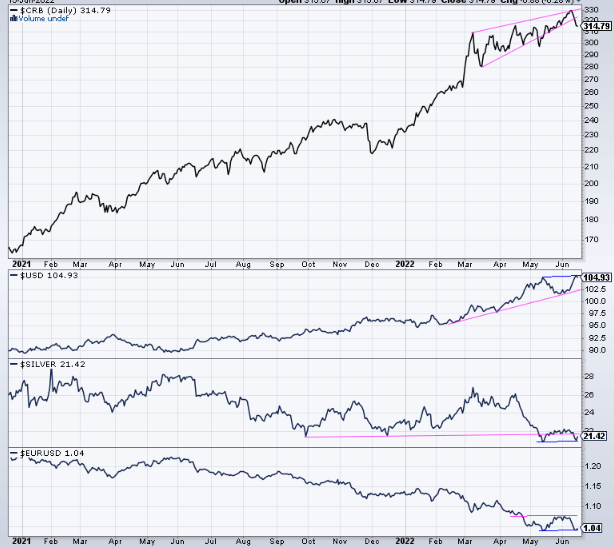
The Commodities Index, Silver, Euro and the USD after the FOMC Meeting Today

The commodities Index could be breaking down here. That’s not to say that some select commodities will not perform well. But overall all we see signs of topping in this index and the price dropped below the important 315$ level that we highlighted here. Soft commodities might be the ones taking a breather here especially considering that many fertilizer stocks have a rounded top pattern therefore rolling over.

Silver has a double bottom but has to clear that $22 resistance soon. We covered the 3 possible scenarios for Silver price extensively here.

Similar to Silver, the Euro seems to be making a double bottom but has a clear overhead resistance level to clear.

The US Dollar seems to be the master puppeteer here especially recently. The price is trading below the Bullish $105 level and could have made a top here. You can find the details of potential future moves in the US dollar in our recent article Where is the USD heading Based on this important secular chart.

To close, we don’t want to make assumptions as to what the US stock market direction will be next. But the charts are showing the inception of what could become potential tops or bottoms in the making. Those price levels will be our indicators to see if the trade is still working.

There is no way to confirm if the hike was priced in unless the US stock market confirms a reversal from here. As for the rate hike and impact on inflation, the increase was accelerated by the war in Ukraine and the impact on energy prices and supply chain.  Best to stick to the chart and not get lost in the reasons behind every move for they are too complex and can be misleading.


Written by hdcharting.

10-YEAR ANNIVERSARY OFFER: InvestingHaven.com celebrates 10 years. Temporarily, you can enjoy a discount on our premium gold/silver and crypto reports. Or you can become a VIP member. Go to our anniversary deals >>
Receive our weekly newsletter.

premium service SP-500 premium service trade alerts premium service crypto teaser 

No related posts.

Taki T.

Taki T.

Taki is a chart analyst who is passionate about unlocking unique insights out the chart. While the vast majority of analysts remain focused on price analysis, Taki starts with timeline analysis and adds price analysis to this. In doing so, he developed a unique methodology to find opportunities in financial markets, across assets and markets.

Connect with InvestingHaven

Receive top notch forecasts for free.

*We hate spam as you do.

Site Navigation

  • RSS Feed
  • About us
  • Advertising
  • Sponsored Content Policy
  • Mission 2026
  • Sitemap
  • Privacy & Disclaimer
  • Terms of Service
  • Contact Us
investing haven logo

Precious metals market analysis including gold and silver price predictions. Crypto market analysis including highly accurate BTC ETH SOL XRP forecasts.

Copyright © 2025 InvestingHaven

Login to your account below

Forgotten Password?

Fill the forms bellow to register

All fields are required. Log In

Retrieve your password

Please enter your username or email address to reset your password.

Log In

Receive top notch forecasts for free.

*We hate spam as you do.

No Result
View All Result
  • News
  • 2025 Forecasts
    • 10 market predictions
    • Dow Jones forecast 2025
    • S&P 500 forecast 2025
    • Nasdaq prediction 2025
    • Best crypto to buy now
    • Which crypto will explode
    • Best altcoins to buy
    • 15 crypto forecasts 2025
    • Which precious metal to buy
  • Silver articles
    • Silver prediction 2025 – 2030
    • Will silver exceed $30?
    • When will silver hit $50?
    • Can silver hit $100?
    • Silver shortage
    • 50-year silver chart
    • Silver bullish reversal
    • Silver seasonality charts
    • How to invest in silver
  • Gold
    • Gold prediction 2025 – 2030
    • Will gold set new ATH?
    • Will gold hit $3,000?
    • Can gold hit $10,000?
    • Gold chart 10 years
    • Gold chart 50 years
    • Gold chart 100 years
    • Gold silver ratio
    • Gold seasonality charts
  • Commodities
    • Sugar forecasts
    • Coffee forecasts
    • Nickel forecasts
    • Lithium investing
  • Crypto news
  • Crypto forecasts
    • BTC prediction 2025 – 2030
    • ETH prediction 2025 – 2030
    • SOL prediction 2025 – 2030
    • XRP prediction 2025 – 2030
    • XLM prediction 2025 – 2030
    • BNB prediction 2025 – 2030
    • ADA prediction 2025 – 2030
    • AVAX prediction 2025 – 2030
    • KAS prediction 2025 – 2030
    • NEAR prediction 2025 – 2030
    • BCH prediction 2025 – 2030
    • LINK prediction 2025 – 2030
    • DOT prediction 2025 – 2030
    • SUI prediction 2025 – 2030
    • ICP prediction 2025 – 2030
    • LTC prediction 2025 – 2026
    • STX prediction 2025 – 2030
    • DOGE prediction 2025 – 2030
    • SHIB prediction 2025 – 2030
    • PEPE prediction 2025 – 2030
    • FLOKI prediction 2025 – 2030
    • WIF prediction 2025 – 2030
    • ONDO prediction 2025 – 2030
  • Premium Crypto Alerts
  • Premium services

Copyright © 2025 InvestingHaven