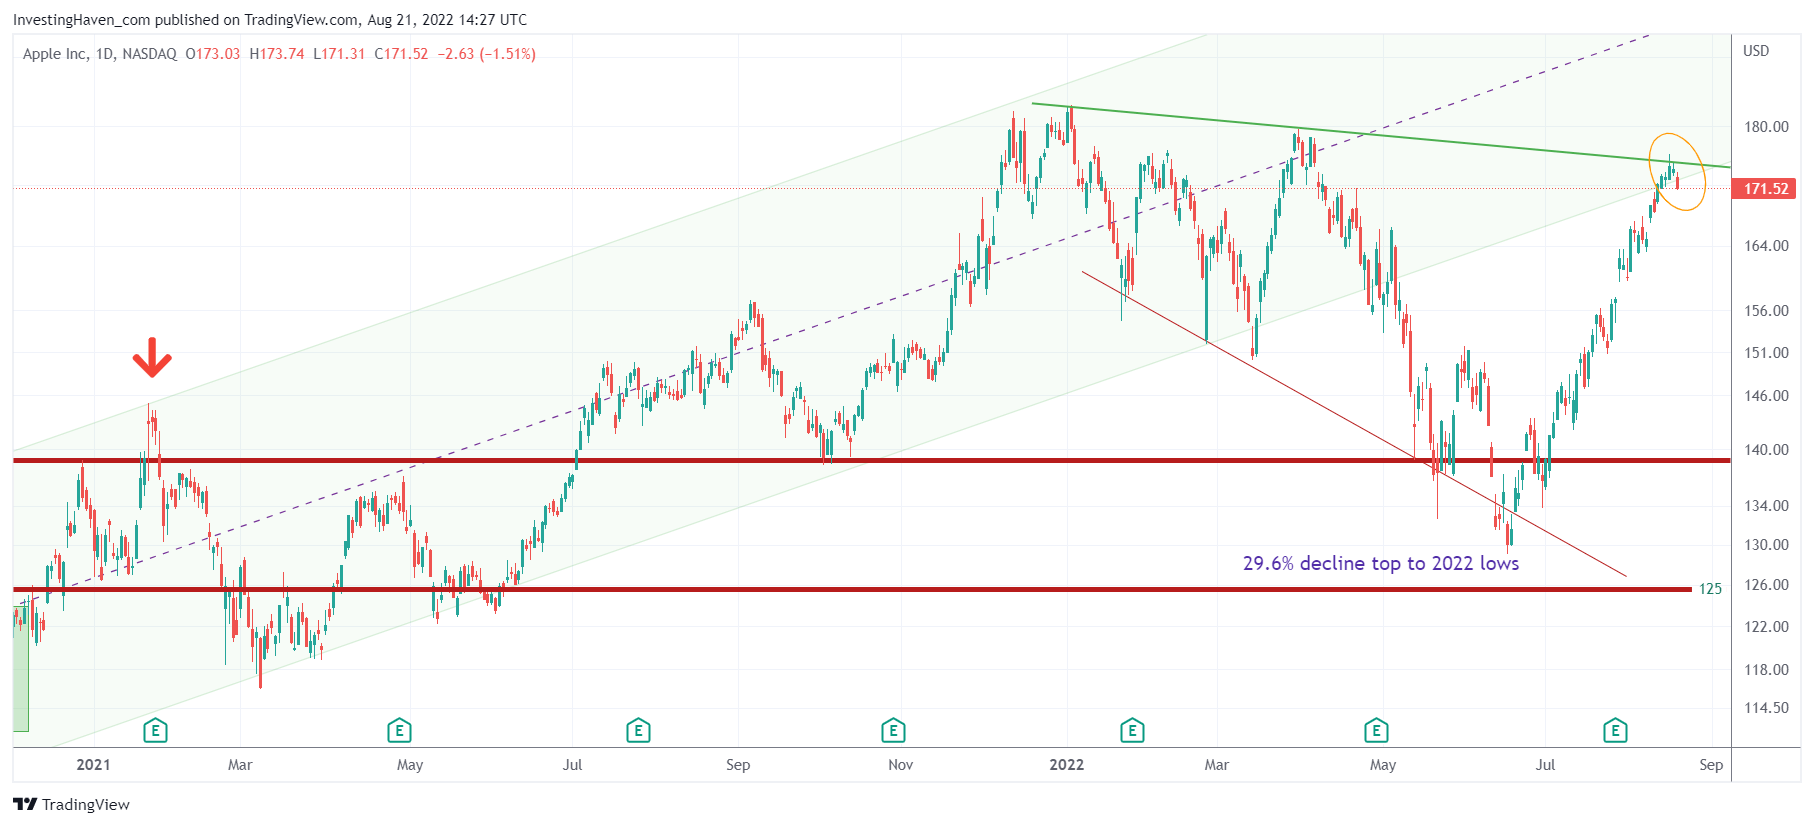
Apple is the largest stock in the S&P 500 and the Nasdaq. We carefully track what Apple is signaling on its chart to understand what indexes are intending to do. At this very point in time, it is clear that Apple wants to move lower because it hit resistance. We are not forecasting a market crash but we do expect a pullback in markets in September.
It is no fun to expect a decline in markets. However, it certainly is interesting to analyze the chart of Apple. There are some really relevant insights to be derived from Apple’s chart structures.
The findings that are worth thinking about:
- There is resistance, double resistance, at current levels. Apple fell below its rising channel back in May, turned lower in May/June and staged a big rally in July/August. The rally stalled right at the rising channel which coincides with a resistance line that connects the 2022 highs.
- The support level that will be tested is 151-156 USD. That’s a 12% pullback. This will drive both the Nasdaq and the S&P 500 lower with at least 6 to 8 pct. Ultimately, 140 USD should hold, is what we are thinking.
So far the easy to observe findings.
It gets more interesting when looking for ongoing chart structures that will define new trends. In that respect, we see the following:
- The period April till August marked a really big reversal. It took some 2.5 months from top to bottom and some 1.5 month from bottom to top.
- Consequently, we can reasonably expect the market to create the 2nd part of the ongoing chart structure, in the coming 2 to 3 months. We expect a similar reversal but with a higher low against June.
- IF our expectation is right, we can reasonably conclude that 2022 was a base building year, characterized by violent swings (in both directions). This sets the stage for a major breakout and bullish trend in 2023.
- IF our expectation is wrong, we will see a major and bearish M-pattern in 2022.
While many investors might go in ‘panic mode’ in September, with a retracement in the cards, we prefer to focus on the longer term structure. We firmly believe that December 1st is the magic date in markets. This forecast gives us 3 full months to assess the 2022 structure which comes with a high probability forecast for 2023.


