Investing Haven
No Result
View All Result
Gold Silver Investing >>
CRYPTO INVESTING >>
  • 2025 Forecasts
    • 10 market predictions
    • Dow Jones forecast
    • S&P 500 forecast 2025
    • Nasdaq prediction 2025
    • Best altcoins to buy
    • Best crypto to buy now
    • Which crypto will explode
    • 15 crypto forecasts 2025
    • Which precious metal to buy
  • Silver
    • Silver prediction 2025 – 2030
    • Will silver exceed $30?
    • When will silver hit $50?
    • Can silver hit $100?
    • Silver shortage
    • 50-year silver chart
    • Silver bullish reversal
    • Silver seasonality charts
    • How to invest in silver
  • Gold
    • Gold prediction 2025 – 2030
    • Will gold set new ATH?
    • Will gold hit $3,000?
    • Can gold hit $10,000?
    • Gold chart 10 years
    • Gold chart 50 years
    • Gold chart 100 years
    • Gold silver ratio
    • Gold seasonality charts
  • Commodities
    • Coffee forecasts
    • Sugar forecasts
    • Nickel forecasts
    • Lithium investing
  • Crypto forecasts
    • BTC prediction 2025 – 2030
    • ETH prediction 2025 – 2030
    • SOL prediction 2025 – 2030
    • XRP prediction 2025 – 2030
    • XLM prediction 2025 – 2030
    • BNB prediction 2025 – 2030
    • ADA prediction 2025 – 2030
    • AVAX prediction 2025 – 2030
    • KAS prediction 2025 – 2030
    • NEAR prediction 2025 – 2030
    • BCH prediction 2025 – 2030
    • LINK prediction 2025 – 2030
    • DOT prediction 2025 – 2030
    • SUI prediction 2025 – 2030
    • ICP prediction 2025 – 2030
    • LTC prediction 2025 – 2026
    • STX prediction 2025 – 2030
    • DOGE prediction 2025 – 2030
    • SHIB prediction 2025 – 2030
    • PEPE prediction 2025 – 2030
    • FLOKI prediction 2025 – 2030
    • WIF prediction 2025 – 2030
    • ONDO prediction 2025 – 2030
  • News
    • Crypto news
    • Commodities
  • Login
Investing Haven
No Result
View All Result

Home » Markets & Stocks » It’s Official: The Weakest Sell-off In History Is A Fact

It’s Official: The Weakest Sell-off In History Is A Fact

Taki T. by Taki T.
February 7, 2021
in Markets & Stocks
historic record markets
2.9k
VIEWS
Share on FacebookShare on Twitter

Last weekend we spotted a powerful bearish setup: bearish stocks, bullish crash indicators VIX and USD. A few days later, the bearish setup was entirely invalidated. We went back 16 years in time to find similar setups, and we were astonished by our own findings: the bearish damage that similar bearish setups produced in the last 16 years was on average a 12% decline in the S&P 500. Last week the same setup entirely invalidated in 3 trading days. This, officially, qualifies as the weakest sell-off in history on an extremely bearish setup. Conclusion that leads to this market forecast: this stock bull market is extremely powerful, and 2021 will be a very bullish year for stocks. This is a data driven, fact based conclusion, not our opinion. We expect the market to crush our Dow Jones Forecast for 2021.

From our update last weekend It’s Official: Dow Jones Correction Started on January 27th, 2021:

We use our standard practice which we call ‘crash indicator analysis’ to understand downside potential and pressure for stock markets. This is a framework of leading indicators that push stocks lower. And the trick is to understand which of those leading ‘crash’ indicators (don’t take the word ‘crash’ too literally) is dominant.

We report on this in our weekend updates to premium members. Last weekend, we wrote Why February Might Be Ugly, When We Will Know And How We’ll Handle It (Jan 24th, 2021)

And we learned in the Corona crash year to stay focused on our crash indicators to try to understand when weakness shows up. In the end the Corona crash was visible in one chart, very much hidden, only visible for those that have an advanced crash indicator analysis method.

We already can see that two of our crash indicators will give us an answer THIS WEEK. Both have a short to medium term impact, and one of the two is the ‘xyz’ chart.

We will know, later this week, whether we expect February to start on a bullish or bearish note, suggesting that scenarios 2 or 3 of the ones outlined above are playing out.

Source: premium research Momentum Investing by InvestingHaven

Fast forward, one week later, and the bearish setup was entirely invalidated already last Wednesday.

It’s very simple: either our market readings were inaccurate, or the bullish power underlying this stock market is extremely powerful. Or both.

In order to ensure that we did our homework well we went back and checked all our chart readings. They were accurate, for sure.

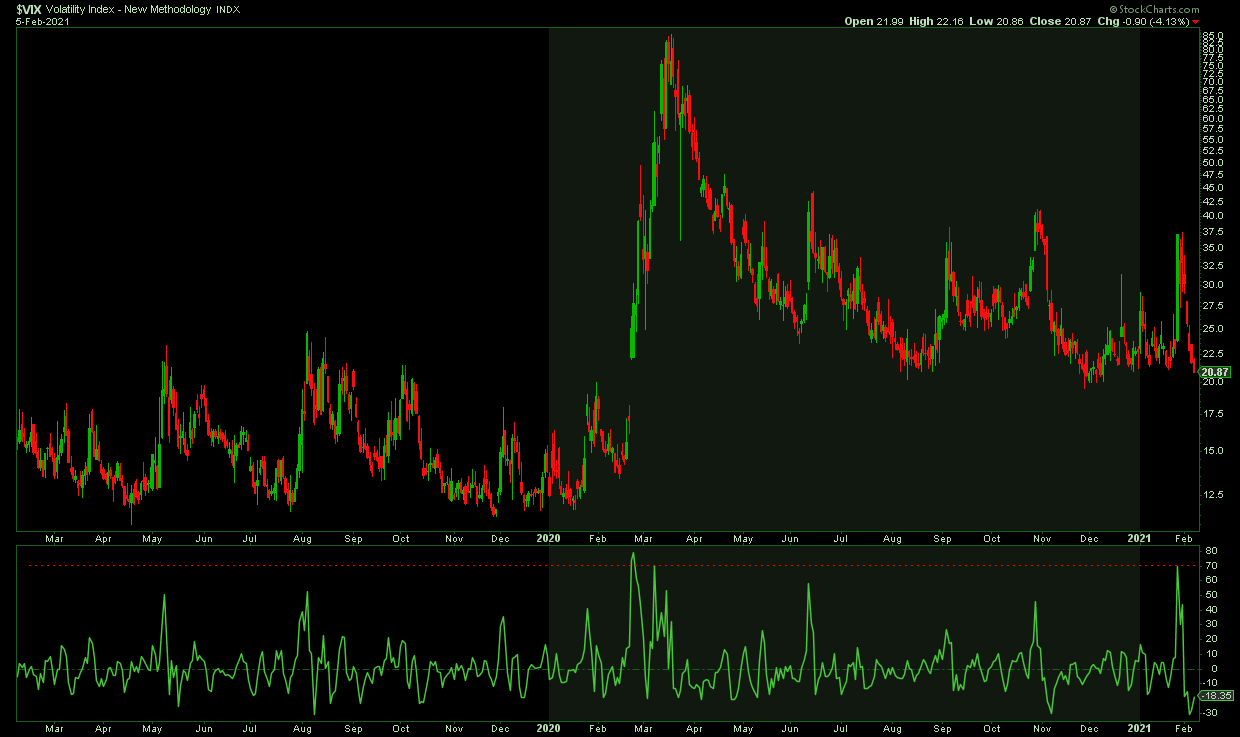
So we went on to find out how powerful this ongoing stock bull market is. And we researched this question: how many times did VIX push at least 70% higher in 3 trading days, and what was the damage to the S&P 500 index?

Our findings were astonishing:

  1. Only 5 instances in the last few decades pushed VIX +70% higher in 3 trading days.
  2. In all those instances, the damage on SPX ranged from 9.7% to 19.5% in 3 to 4 trading days. The average drop was 12.5% in SPX.
  3. In all those instances the recovery was slow, and mostly indexes went lower for an extended period of time before moving higher.
  4. Even during the 2008/9 crash there wasn’t such a violent move in VIX.
  5. Last week, the SPX impact was a laughable 4.3%, and 4 days later SPX was trading higher than where it started ‘dropping’.

Below is the VIX chart from 2019 till today, and the VIX ‘rate of change’ is featured in the lower pane. We can clearly observe the explosiveness of VIX was in the last week of January. What was the ‘damage’ that it created to SPX? The SPX index dropped from 3869 to 3695 points, a 4.3% drop, and 4 trading days later SPX hit new highs at 3872.

We are having a hard time believing a 30% market crash will occur, as per this news item.

VIX rate of change

10-YEAR ANNIVERSARY OFFER: InvestingHaven.com celebrates 10 years. Temporarily, you can enjoy a discount on our premium gold/silver and crypto reports. Or you can become a VIP member. Go to our anniversary deals >>
Receive our weekly newsletter.

premium service SP-500 premium service trade alerts premium service crypto teaser 

No related posts.

Tags: Dow Jones charts
Taki T.

Taki T.

Taki is a chart analyst who is passionate about unlocking unique insights out the chart. While the vast majority of analysts remain focused on price analysis, Taki starts with timeline analysis and adds price analysis to this. In doing so, he developed a unique methodology to find opportunities in financial markets, across assets and markets.

Connect with InvestingHaven

Receive top notch forecasts for free.

*We hate spam as you do.

Site Navigation

  • RSS Feed
  • About us
  • Advertising
  • Sponsored Content Policy
  • Mission 2026
  • Sitemap
  • Privacy & Disclaimer
  • Terms of Service
  • Contact Us
investing haven logo

Precious metals market analysis including gold and silver price predictions. Crypto market analysis including highly accurate BTC ETH SOL XRP forecasts.

Copyright © 2025 InvestingHaven

Login to your account below

Forgotten Password?

Fill the forms bellow to register

All fields are required. Log In

Retrieve your password

Please enter your username or email address to reset your password.

Log In

Receive top notch forecasts for free.

*We hate spam as you do.

No Result
View All Result
  • News
  • 2025 Forecasts
    • 10 market predictions
    • Dow Jones forecast 2025
    • S&P 500 forecast 2025
    • Nasdaq prediction 2025
    • Best crypto to buy now
    • Which crypto will explode
    • Best altcoins to buy
    • 15 crypto forecasts 2025
    • Which precious metal to buy
  • Silver articles
    • Silver prediction 2025 – 2030
    • Will silver exceed $30?
    • When will silver hit $50?
    • Can silver hit $100?
    • Silver shortage
    • 50-year silver chart
    • Silver bullish reversal
    • Silver seasonality charts
    • How to invest in silver
  • Gold
    • Gold prediction 2025 – 2030
    • Will gold set new ATH?
    • Will gold hit $3,000?
    • Can gold hit $10,000?
    • Gold chart 10 years
    • Gold chart 50 years
    • Gold chart 100 years
    • Gold silver ratio
    • Gold seasonality charts
  • Commodities
    • Sugar forecasts
    • Coffee forecasts
    • Nickel forecasts
    • Lithium investing
  • Crypto news
  • Crypto forecasts
    • BTC prediction 2025 – 2030
    • ETH prediction 2025 – 2030
    • SOL prediction 2025 – 2030
    • XRP prediction 2025 – 2030
    • XLM prediction 2025 – 2030
    • BNB prediction 2025 – 2030
    • ADA prediction 2025 – 2030
    • AVAX prediction 2025 – 2030
    • KAS prediction 2025 – 2030
    • NEAR prediction 2025 – 2030
    • BCH prediction 2025 – 2030
    • LINK prediction 2025 – 2030
    • DOT prediction 2025 – 2030
    • SUI prediction 2025 – 2030
    • ICP prediction 2025 – 2030
    • LTC prediction 2025 – 2026
    • STX prediction 2025 – 2030
    • DOGE prediction 2025 – 2030
    • SHIB prediction 2025 – 2030
    • PEPE prediction 2025 – 2030
    • FLOKI prediction 2025 – 2030
    • WIF prediction 2025 – 2030
    • ONDO prediction 2025 – 2030
  • Premium Crypto Alerts
  • Premium services

Copyright © 2025 InvestingHaven