The stock market has been experiencing a wide consolidation period since last May. This makes for a wide consolidation over 14 months on leading indexes like the S&P 500. Shorter term, however, chart analysis suggests that a turning point occurred on June 16th, 2023. In this blog post, we will delve into the implications of this turning point and discuss the potential for increased selling in the market. Additionally, we will forecast the projected date for the next turning point.
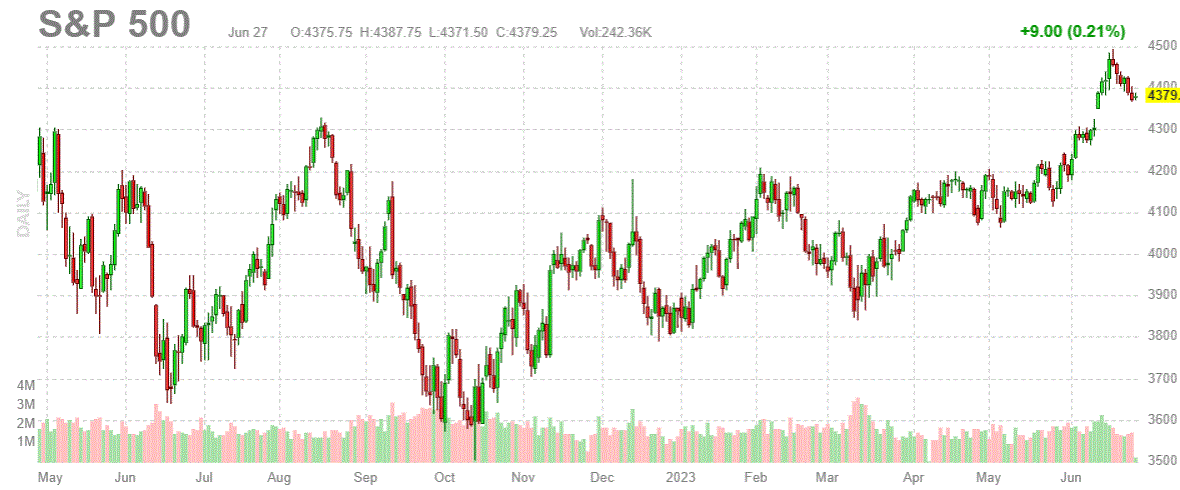
To illustrate the market dynamics, let’s examine the S&P 500 chart, without annotations, embedded below.
The daily S&P 500 chart depicts a prolonged consolidation pattern, resembling a bullish reversal over a span of 14 months. Notably, the breakout level occurred at 4300 points in SPX futures (slightly lower in the SPX index). While the official breakout took place on June 12th, it becomes evident that resistance was encountered on June 16th. This particular date stands out as a significant turning point.
Interpreting the Chart
Analyzing the chart pattern, it becomes apparent that June 16th marked a crucial moment in the market’s trajectory. This observation aligns with InvestingHaven’s prior forecast, which warned of potential turbulence in June: Enjoy The Party But Watch Out June Won’t Come With A ‘Happy End’
We firmly believe that the end of June will the opposite of early June: higher first in June, much lower in the last days of June.
Therefore, we stick to what we said before: “The first days of June are meant to observe what has / has no momentum, the last days of June will be to enter those stocks. First the selection, wait / no action, then action around June 30th, 2023.”
The significance of June 16th lies in its potential as a catalyst for market movements.
Implications for Selling Pressure
Given the observed turning point, it raises the question of whether selling pressure will intensify in the coming hours and days. While it is challenging to predict market behavior with certainty, InvestingHaven’s analysis suggests that selling is likely to pick up this week. The key to gauging the severity of the selling pressure will be monitoring the market’s response over the next 72 hours. This period will provide valuable insights into whether the selling will be relatively mild or more intense.
Identifying the Next Turning Point
Another crucial aspect to consider is the projected timeframe for the next turning point. Based on InvestingHaven’s analysis, the next significant turning point is expected to occur no later than July 7th. This timeframe serves as a guide for investors and traders to remain vigilant and closely monitor market developments.
Conclusion
The stock market has experienced a significant turning point on June 16th, as indicated by the SPX 500 chart analysis. This turning point aligns with InvestingHaven’s prior forecast, urging caution during the month of June. It is important for market participants to be aware of the potential for increased selling pressure in the coming days, with the severity to be determined by market response. Additionally, investors should keep a close eye on developments leading up to the projected next turning point, which is expected no later than July 7th. By staying informed and agile, market participants can navigate these potentially volatile times more effectively.


