What a turnaround in stocks, in one week time. It’s amazing. One week ago we reported that stocks were in overdrive. Since then, though, intermarket dynamics pushed too hard, especially Treasuries fell too fast. Not healthy, and indicative of speculation. Stocks are probably anticipating a short to medium term turnaround in markets now. Long term stocks are bullish, short to medium term they need to shrug off excessive momentum that lasted 4 months!
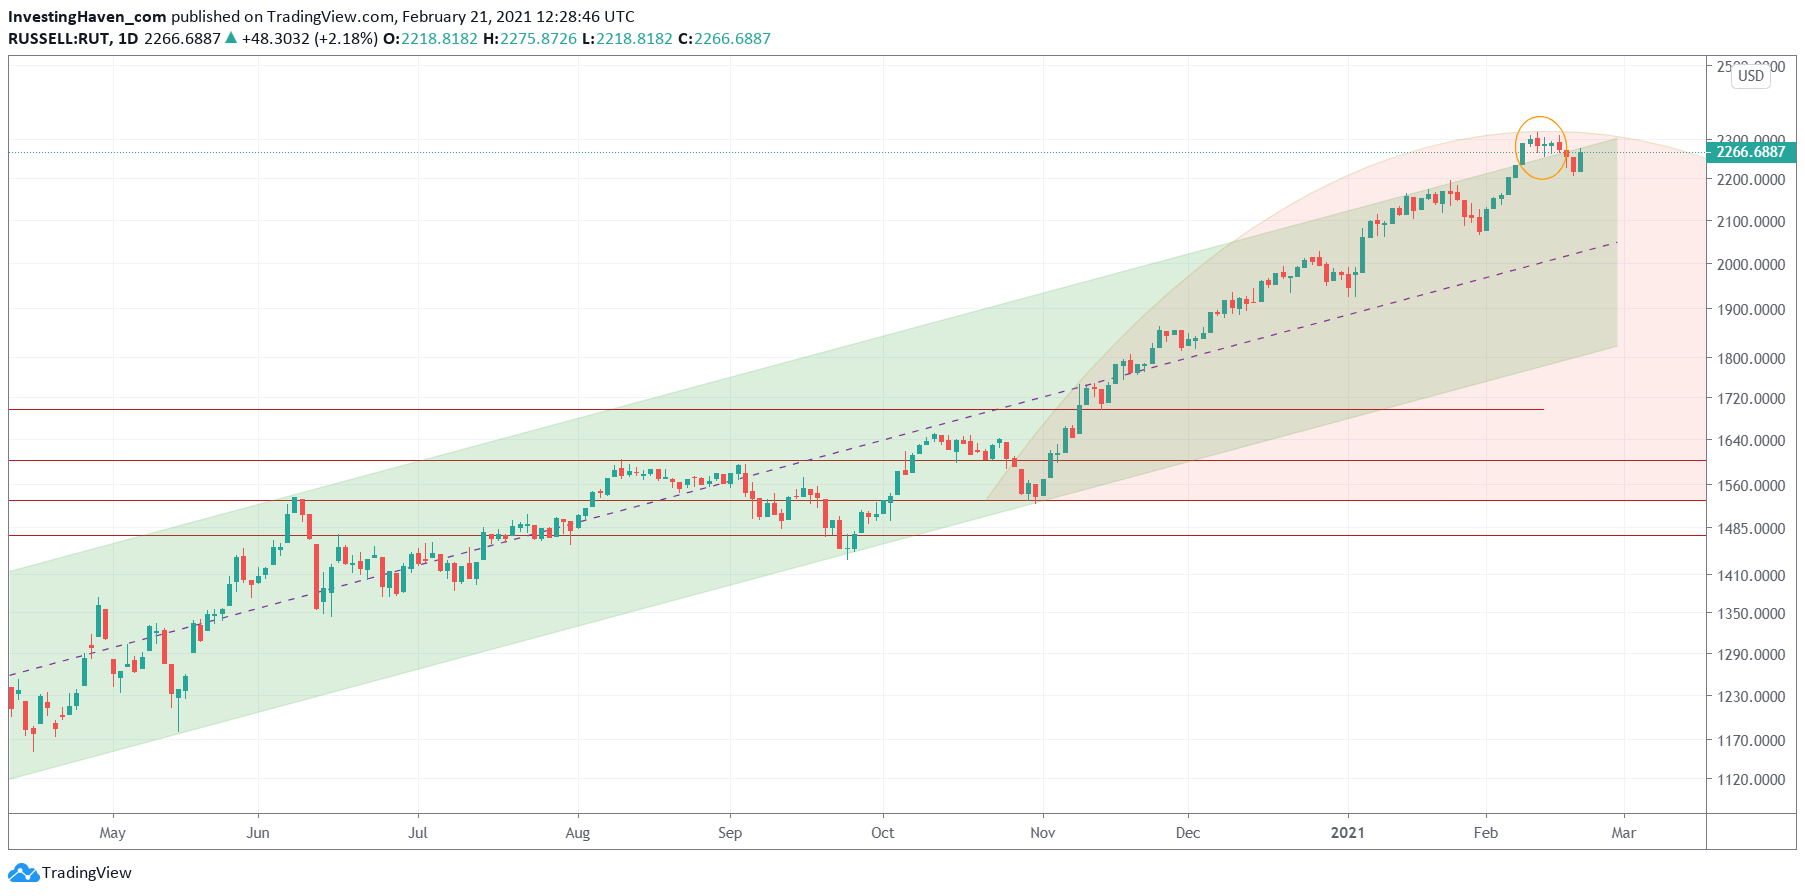
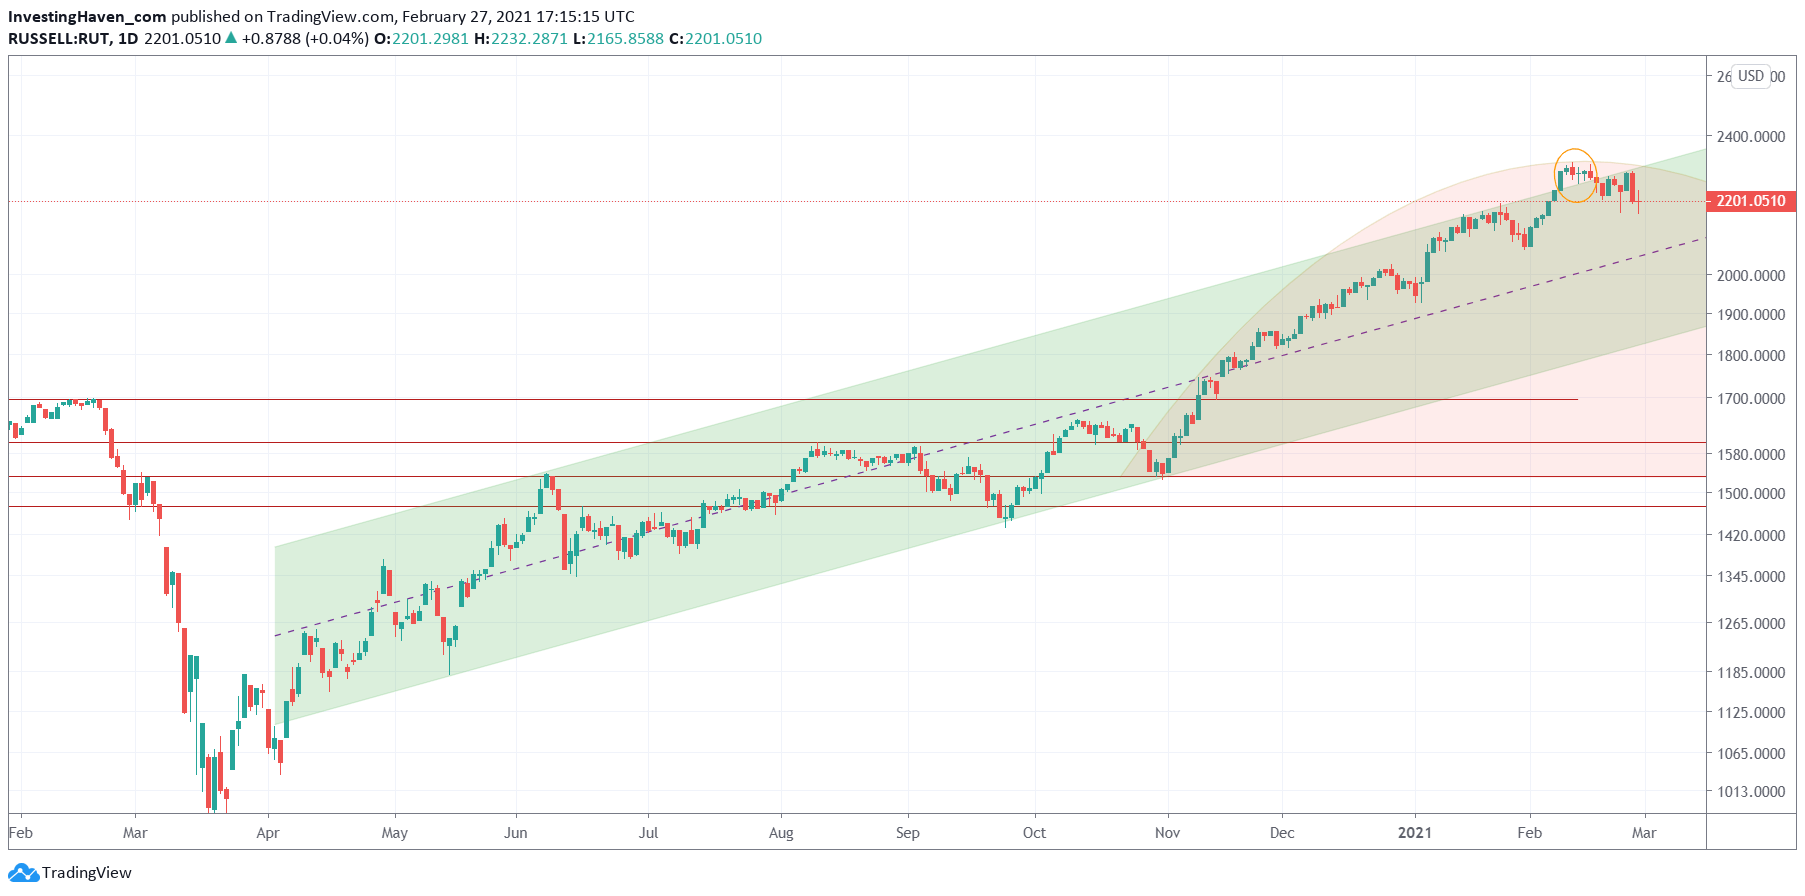
The Russell 2000 chart is one of our leading stock indicators.
Its chart one week ago:
Its chart today:
If anything, this above chart looks really vulernable now. Very vulnerable. More downside than upside potential, it should be crystal clear to anyone who is able to look in an objective way.
But wait a second, didn’t we say here on the same blog just one week ago that Stocks Will Be Uber Bullish In 2021 Because Of This Monster Breakdown In Treasuries?
Yes we did, and Treasuries did exaggerate since then.
What a difference one week can make, right.
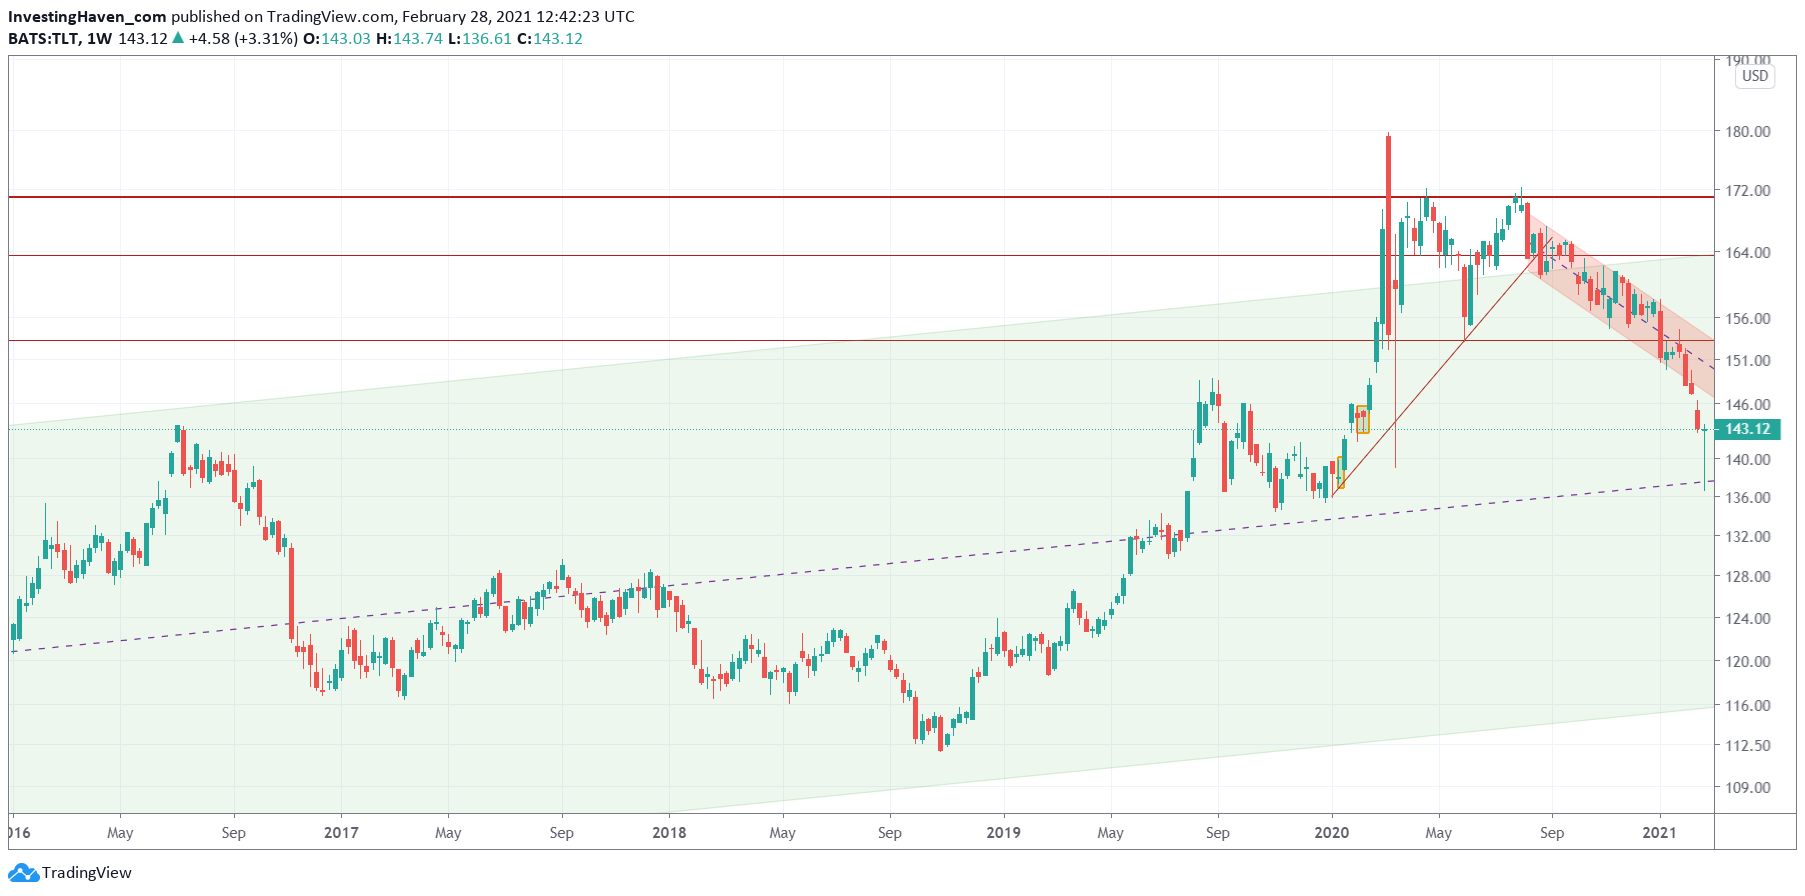
The Treasuries chart accelerated its move lower, but went in overdrive. It found ‘support’ at its multi-decade median line. The big wick on the last weekly candle on below chart is over the top, and it is likely supporting evidence of a weakening stock market, when combined with the VIX chart.
We believe March will be volatile, and next week we will see if the ‘buy the dip’ will occur or not. We have serious doubts!


