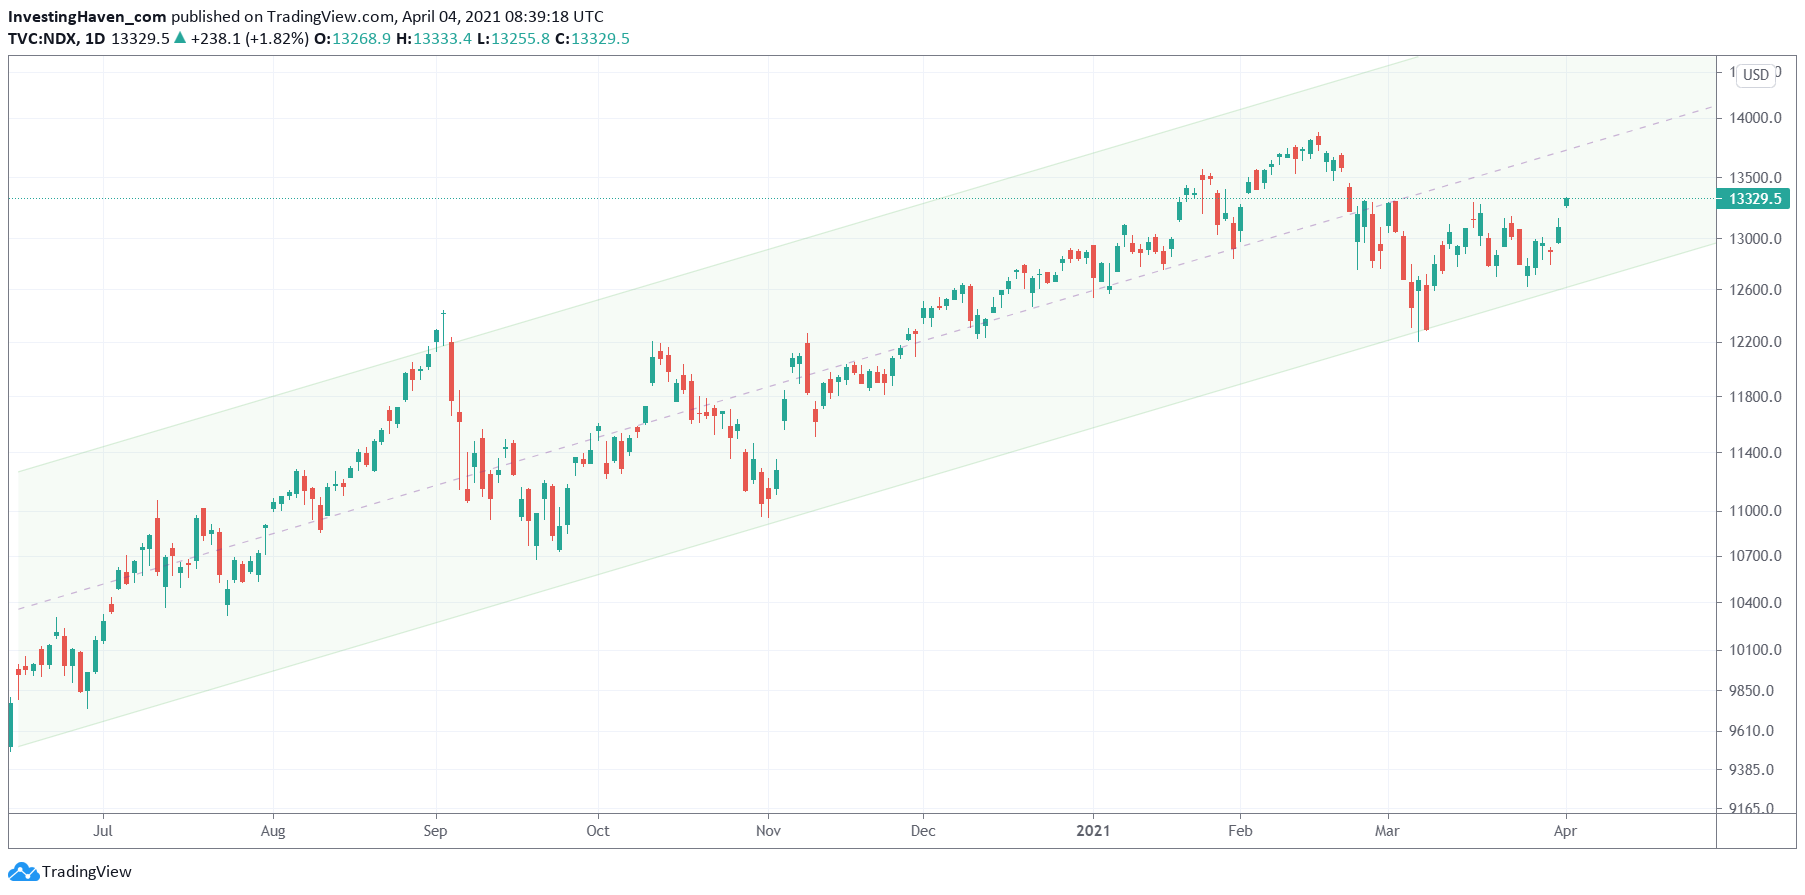
Investors often make things more complicated than they are. More often than not it is a matter of waiting for the right timing to make a conclusion about a trend and/or an envisioned position. In this world of information overload, minute based chart timeframes, instant results … there is one skill that is becoming rare: patience. If we apply this to the Nasdaq index we see a very nice reversal shaping up after a violent decline over the last 6 weeks. And yes, from a chart perspective we got a test of support of a longer term rising channel with a higher low, as simple as can be. We remain bullish on stocks for 2021 as per our 2021 forecast, but we predict stronger market rotation than last year.
The next chart makes the point.
It is clear that mid-February was a pivot point on the medium term timeframe. In the end the Nasdaq index moved above its Jan 1st, 2021 opening price, came back down since mid-February and opened April approx. at its January opening price.
It may be true that in recent months the Dow Jones index outperformed the Nasdaq, as per this article of Marketwatch The Dow just beat the Nasdaq by the widest margin in a month since 2002. Here’s how stocks tend to perform afterward. However, that’s the past, the only question is what’s the path forward.
As per below chart it is very likely that Nasdaq is going to be a leader (again) either in April or soon after (in the 4 to 8 weeks that follow April).
You don’t need to be an experienced chartists to understand this trend pattern, and you also don’t need to be a chartist to understand validation and invalidation prices, respectively 13,000 and 12,500 points.
We continue to see ‘market rotation on steroids’: fast, violent, often rather hidden.
This implies that our thesis as reported last week Market Trends Will Be Challenging To Identify In 2021 is valid, and will continue to be dominant.


