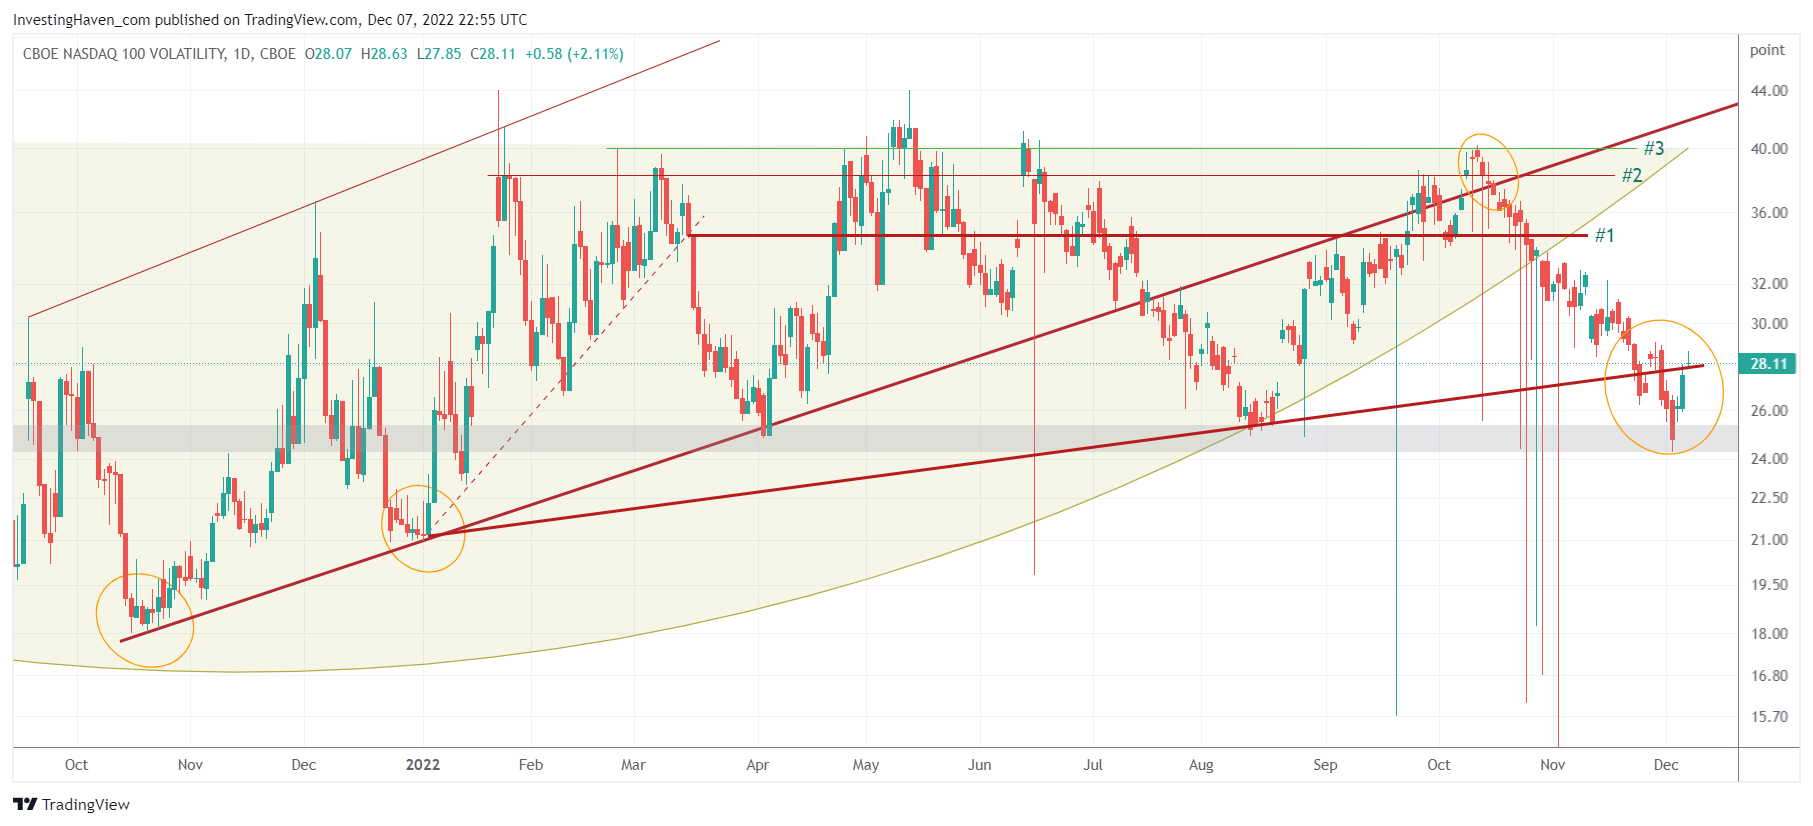
Leading indicators are crucial for financial market investors. A leading indicator complements stock index charts. When it comes to the Nasdaq we use its not well-known volatility index to help us predict the next trend. We explained this in more detail in Here Is Why Volatility Analysis Can Be Powerful And Even Predictive.
The Nasdaq volatility index has a really interesting setup right now.
A few observations from the Nasdaq volatility index chart (annotations ours):
- The 2022 rising trendline got broken to the downside last week. However, as per yesterday’s readings, this index is flirting with that same trendline, see orange circle. What this really means is that the downtrend in the Nasdaq (inversely correlated to the Nasdaq volatility index index) is thoroughly being tested now. As soon as the Nasdaq volatility index trades for 5 full days below the rising trendline on the Nasdaq volatility index chart we have a high probability that the downtrend in the Nasdaq is ending and a new uptrend is going to come next.
- Horizontal support (grey bar) is holding up, for now. Again, remember, the Nasdaq volatility index is inversely correlated to the Nasdaq. This index went above this grey horizontal support area in January of 2022. It tested it in April, August and last week. Whenever the Nasdaq volatility index falls below 24 points you know for sure that the downtrend ended and that 2023 will be bullish, not bearish, contrary to what many experts are trying to sell you: The Market Will Not Move 50% Lower Contrary To What The Gurus Are Telling You.
We are closely monitoring the Nasdaq and its volatility index. Today, we opened a new position in a very promising Nasdaq stock, in our Momentum Investing portfolio.


