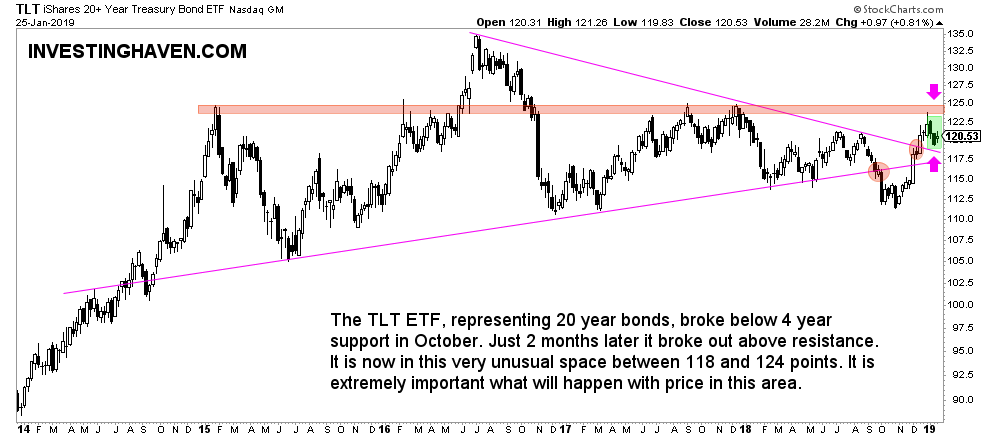
What’s next in markets? After peak fear on a global market crash, and especially a stock market crash in 2019, the million dollar question is in which direction markets move next. 20 Year Treasuries which is one of our 15 leading indicators has a breath taking chart setup. Essentially, it is a very important risk barometer. Its chart shows a setup which leads us to the conclusion that this ultimate risk barometer is sandwiched. The resolution will be crucial for global investors in every market.
As per our 100 investing tips which are aimed to help long term investors:
All major moves in markets, especially market crashes, start with major turning points in credit and currency markets. That’s why 10 and 20 year rates, as well as leading currency pairs, have the most influence on all other markets, including stock markets around the globe.
That’s why we attach a very high importance to 10 year Yields as well as 20 year Treasury prices. Obviously, we don’t look into the news, because there is always bad news. Don’t forget that news makers are in business to sell advertising, has always been like this and will not change. Charts of leading indicators are the ones that matter for serious investors.
The chart of 20 year Treasury prices is the one we focus on. It shows this breakdown (risk-on) in October but then got followed by a breakout (risk-off) in December.
Right now, it is sandwiched between this triangle formation and a major resistance area (red bar on the chart, our annotation).
What happens in this area between 118 and 124 points in TLT ETF will be crucial for global markets. This is one of the few indicators worth following as opposed to news that is meant to sell advertising.


