Investing Haven
No Result
View All Result
Gold Silver Investing >>
CRYPTO INVESTING >>
  • 2025 Forecasts
    • 10 market predictions
    • Dow Jones forecast
    • S&P 500 forecast 2025
    • Nasdaq prediction 2025
    • Best altcoins to buy
    • Best crypto to buy now
    • Which crypto will explode
    • 15 crypto forecasts 2025
    • Which precious metal to buy
  • Silver
    • Silver prediction 2025 – 2030
    • Will silver exceed $30?
    • When will silver hit $50?
    • Can silver hit $100?
    • Silver shortage
    • 50-year silver chart
    • Silver bullish reversal
    • Silver seasonality charts
    • How to invest in silver
  • Gold
    • Gold prediction 2025 – 2030
    • Will gold set new ATH?
    • Will gold hit $3,000?
    • Can gold hit $10,000?
    • Gold chart 10 years
    • Gold chart 50 years
    • Gold chart 100 years
    • Gold silver ratio
    • Gold seasonality charts
  • Commodities
    • Coffee forecasts
    • Sugar forecasts
    • Nickel forecasts
    • Lithium investing
  • Crypto forecasts
    • BTC prediction 2025 – 2030
    • ETH prediction 2025 – 2030
    • SOL prediction 2025 – 2030
    • XRP prediction 2025 – 2030
    • XLM prediction 2025 – 2030
    • BNB prediction 2025 – 2030
    • ADA prediction 2025 – 2030
    • AVAX prediction 2025 – 2030
    • KAS prediction 2025 – 2030
    • NEAR prediction 2025 – 2030
    • BCH prediction 2025 – 2030
    • LINK prediction 2025 – 2030
    • DOT prediction 2025 – 2030
    • SUI prediction 2025 – 2030
    • ICP prediction 2025 – 2030
    • LTC prediction 2025 – 2026
    • STX prediction 2025 – 2030
    • DOGE prediction 2025 – 2030
    • SHIB prediction 2025 – 2030
    • PEPE prediction 2025 – 2030
    • FLOKI prediction 2025 – 2030
    • WIF prediction 2025 – 2030
    • ONDO prediction 2025 – 2030
  • News
    • Crypto news
    • Commodities
  • Login
Investing Haven
No Result
View All Result

Home » Markets & Stocks » S&P 500 Charts Ultra Bullish Long Term, But Vulnerable Short To Medium Term

S&P 500 Charts Ultra Bullish Long Term, But Vulnerable Short To Medium Term

Taki T. by Taki T.
May 2, 2021
in Markets & Stocks
bull with mask
2.4k
VIEWS
Share on FacebookShare on Twitter

In a world of fast moving information and content overload it is easy to get caught up in the short timeframes. Over here at InvestingHaven we always check all timeframes, in a top down fashion (longest timeframes first). When looking at the S&P 500 charts we get really excited about the long term chart. It is clear that ultimately this market will crush our 2021 forecasts acknowledging we predicted a bullish market. However, short to medium term this market is vulnerable. This is why.

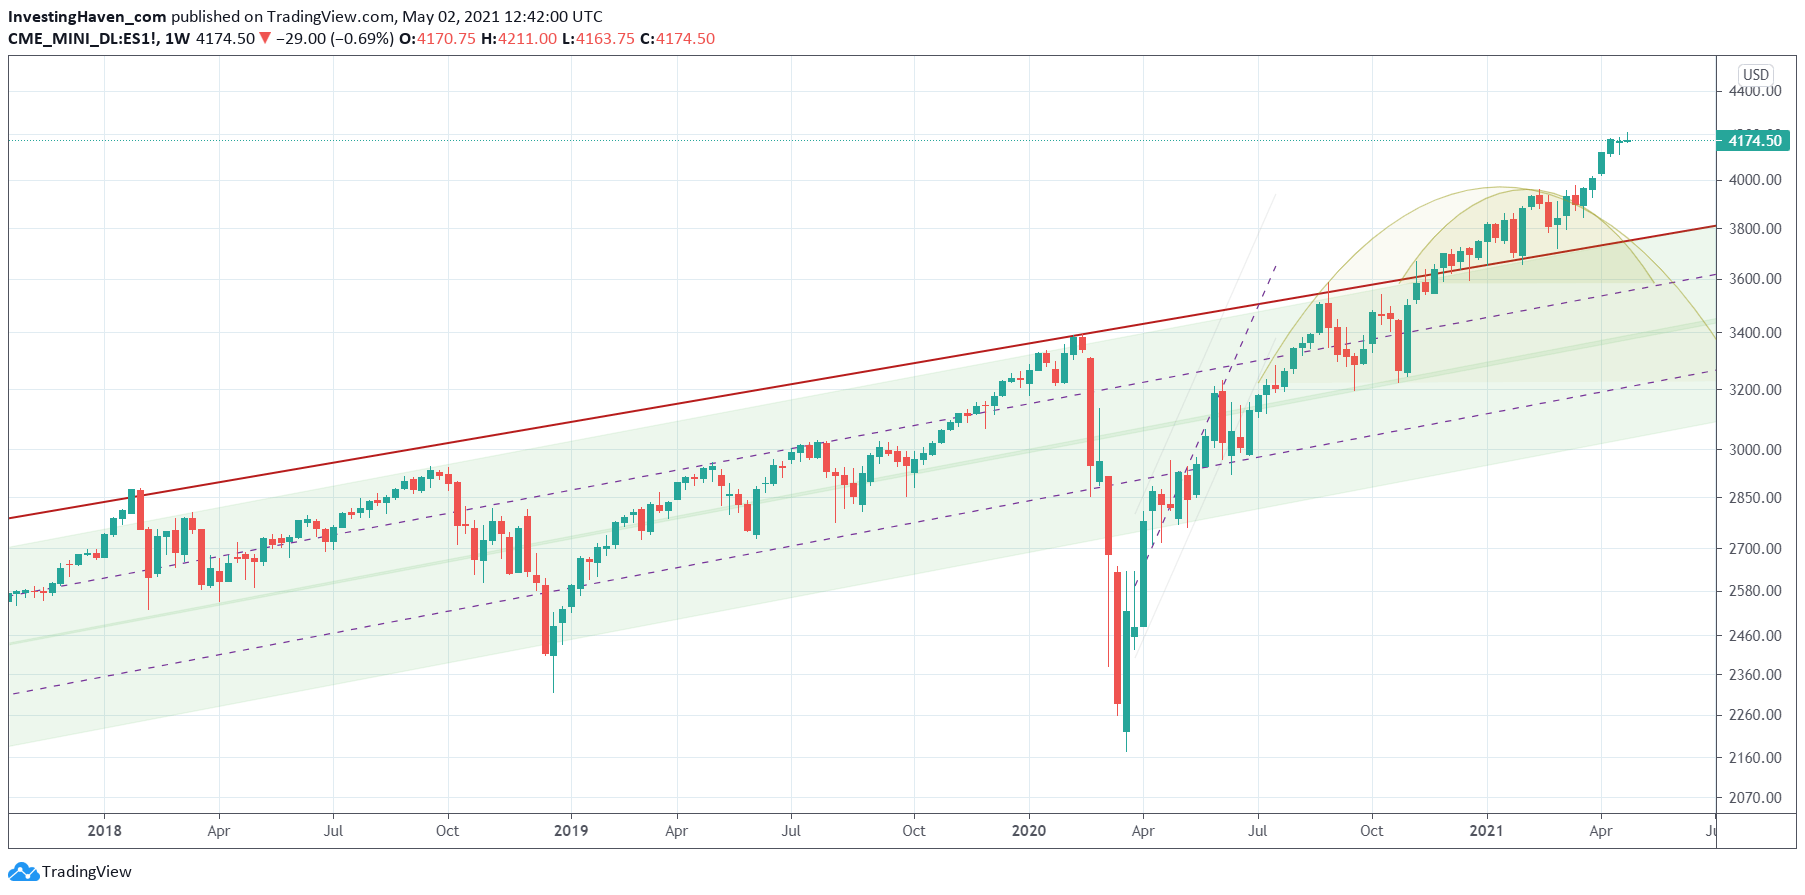
The weekly S&P 500 chart has the answer, and what a strong setup we see on there.

Early March we wrote this A Beautiful Secular Trendline On The S&P 500 Chart. In there

The secular S&P 500 chart on 40 years has one simple trendline which has been decisive since 1983:

  • This trendline was touched in 1983 before a major bull market started which lasted 17 years.
  • It was when the 2008 market crash accelerated that this long term trendline was broken to the downside.
  • In 2014/2015 this trendline provided resistance after which the 2015/2016 temporary downtrend in stocks started.
  • It was exactly at that point where the epic 2020 Corona crash started.
  • Since December of 2020 the S&P 500 trades above this secular trendline, and has tested it multiple times as support.

Let’s review where the market currently trades against this trendline: it is above it for +1 month now!

The thick red rising trendline on the first chart, the weekly chart, is the one we were referring to earlier. We observe some 7 weekly candles above this trendline, without touching it.

This really suggests that stocks are accelerating their uptrend in the really bigger scheme of things. The good news: more upside, and the ideal environment for some sectors to go ild. The bad news: a bubble is underway!

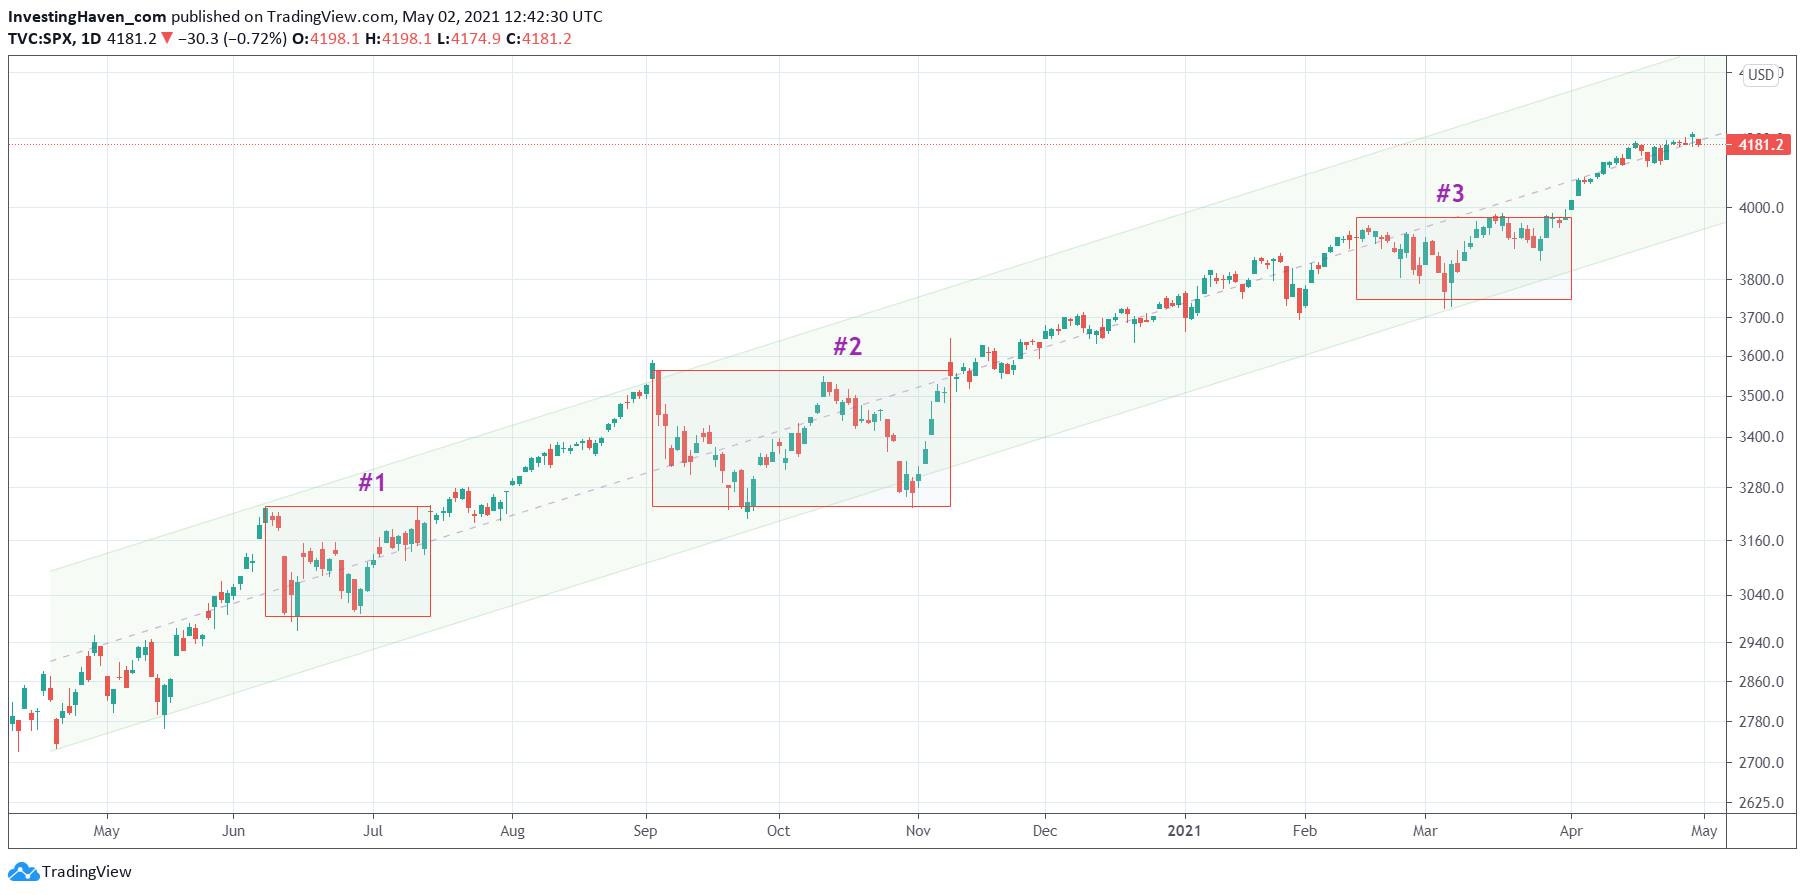
The daily chart post-Corona crash simply shows how strong the uptrend since last April has been. Right now the S&P 500 trades exactly at its median line. It looks a bit tired. We believe it is vulnerable to move back to 4,000 points before or around summer time. This would be a healthy retracement in the context of a long term uptrend.


10-YEAR ANNIVERSARY OFFER: InvestingHaven.com celebrates 10 years. Temporarily, you can enjoy a discount on our premium gold/silver and crypto reports. Or you can become a VIP member. Go to our anniversary deals >>
Receive our weekly newsletter.

premium service SP-500 premium service trade alerts premium service crypto teaser 

No related posts.

Tags: SPX
Taki T.

Taki T.

Taki is a chart analyst who is passionate about unlocking unique insights out the chart. While the vast majority of analysts remain focused on price analysis, Taki starts with timeline analysis and adds price analysis to this. In doing so, he developed a unique methodology to find opportunities in financial markets, across assets and markets.

Connect with InvestingHaven

Receive top notch forecasts for free.

*We hate spam as you do.

Site Navigation

  • RSS Feed
  • About us
  • Advertising
  • Sponsored Content Policy
  • Mission 2026
  • Sitemap
  • Privacy & Disclaimer
  • Terms of Service
  • Contact Us
investing haven logo

Precious metals market analysis including gold and silver price predictions. Crypto market analysis including highly accurate BTC ETH SOL XRP forecasts.

Copyright © 2025 InvestingHaven

Login to your account below

Forgotten Password?

Fill the forms bellow to register

All fields are required. Log In

Retrieve your password

Please enter your username or email address to reset your password.

Log In

Receive top notch forecasts for free.

*We hate spam as you do.

No Result
View All Result
  • News
  • 2025 Forecasts
    • 10 market predictions
    • Dow Jones forecast 2025
    • S&P 500 forecast 2025
    • Nasdaq prediction 2025
    • Best crypto to buy now
    • Which crypto will explode
    • Best altcoins to buy
    • 15 crypto forecasts 2025
    • Which precious metal to buy
  • Silver articles
    • Silver prediction 2025 – 2030
    • Will silver exceed $30?
    • When will silver hit $50?
    • Can silver hit $100?
    • Silver shortage
    • 50-year silver chart
    • Silver bullish reversal
    • Silver seasonality charts
    • How to invest in silver
  • Gold
    • Gold prediction 2025 – 2030
    • Will gold set new ATH?
    • Will gold hit $3,000?
    • Can gold hit $10,000?
    • Gold chart 10 years
    • Gold chart 50 years
    • Gold chart 100 years
    • Gold silver ratio
    • Gold seasonality charts
  • Commodities
    • Sugar forecasts
    • Coffee forecasts
    • Nickel forecasts
    • Lithium investing
  • Crypto news
  • Crypto forecasts
    • BTC prediction 2025 – 2030
    • ETH prediction 2025 – 2030
    • SOL prediction 2025 – 2030
    • XRP prediction 2025 – 2030
    • XLM prediction 2025 – 2030
    • BNB prediction 2025 – 2030
    • ADA prediction 2025 – 2030
    • AVAX prediction 2025 – 2030
    • KAS prediction 2025 – 2030
    • NEAR prediction 2025 – 2030
    • BCH prediction 2025 – 2030
    • LINK prediction 2025 – 2030
    • DOT prediction 2025 – 2030
    • SUI prediction 2025 – 2030
    • ICP prediction 2025 – 2030
    • LTC prediction 2025 – 2026
    • STX prediction 2025 – 2030
    • DOGE prediction 2025 – 2030
    • SHIB prediction 2025 – 2030
    • PEPE prediction 2025 – 2030
    • FLOKI prediction 2025 – 2030
    • WIF prediction 2025 – 2030
    • ONDO prediction 2025 – 2030
  • Premium Crypto Alerts
  • Premium services

Copyright © 2025 InvestingHaven