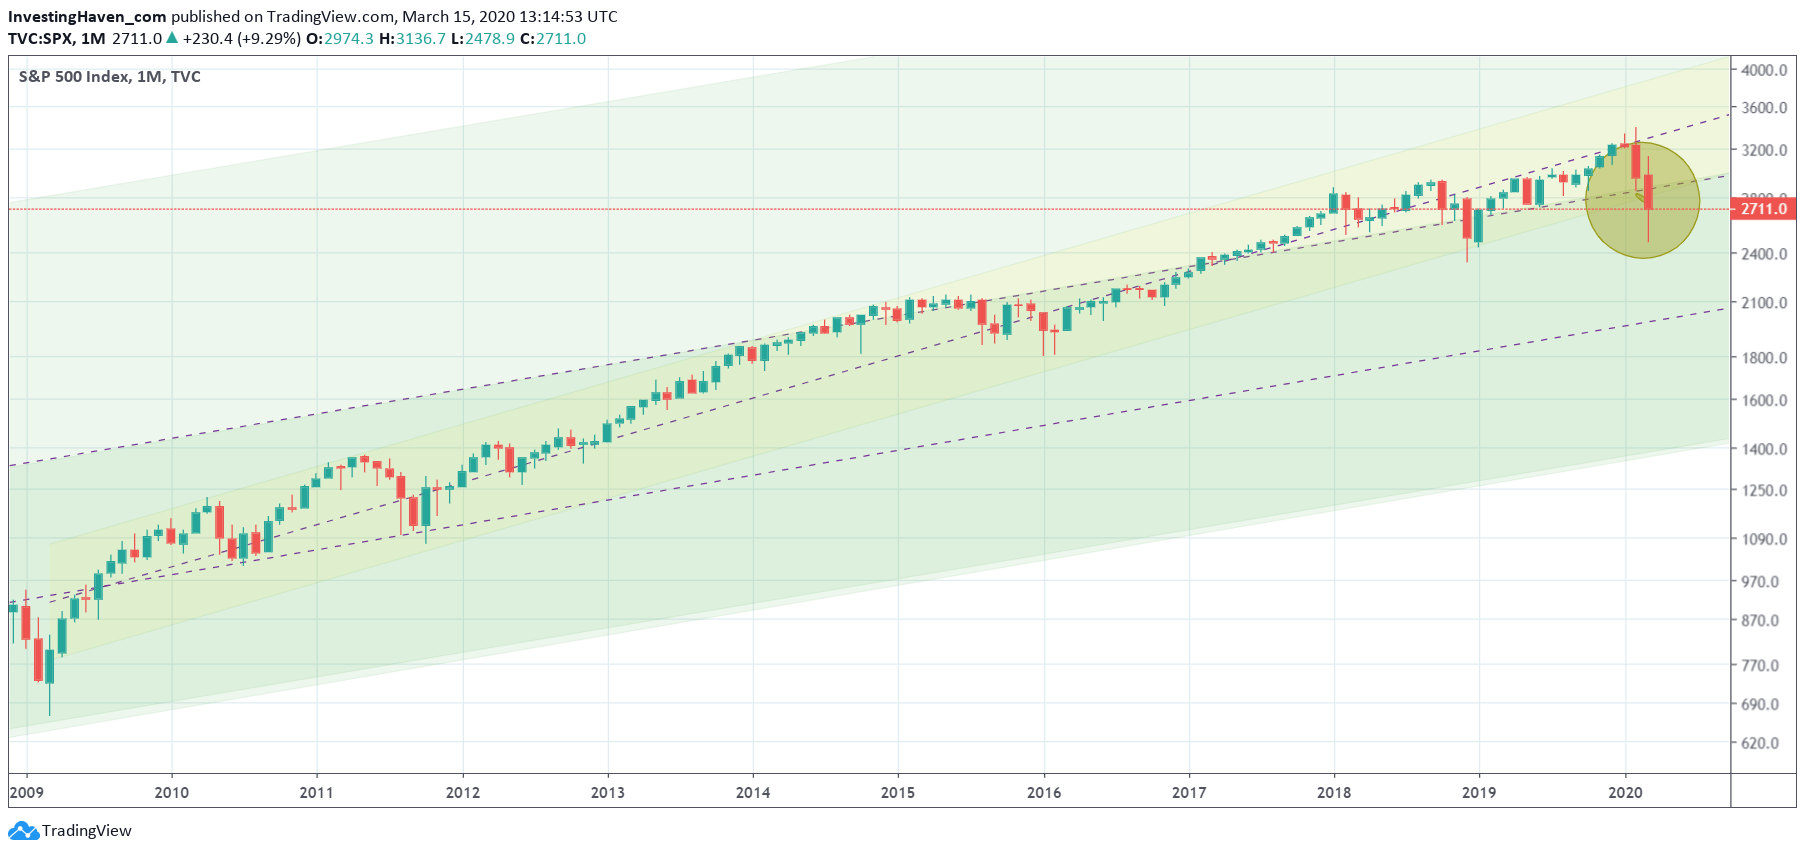
This week’s tsunami of selling created lots of damage as it registered a never seen ‘peak of fear‘. All equities came down, significantly. Our bullish stock market forecast may be at risk because of this. The S&P500 is now testing its 2009 bull market trend on the monthly and weekly charts. The likelihood that it may hold is now decreasing fast with every passing day. Both the monthly and weekly charts are featured in this article.
In a top down approach we start with the weekly S&P500 chart.
The 2009 bull market is shown in yellow. Look at the exceptional red candles from Feb and March (not complete though). The first one held around the 2009 uptrend level, the current one fell below it (at the time of writing).
Moreover we are now trading at a pivotal point: the crossing of median line of the multi-decade uptrend (green background) and the support level of the 2009 uptrend (support of the yellow channel). Pretty high significance of this crossing, and certainly it did create immense volatility.

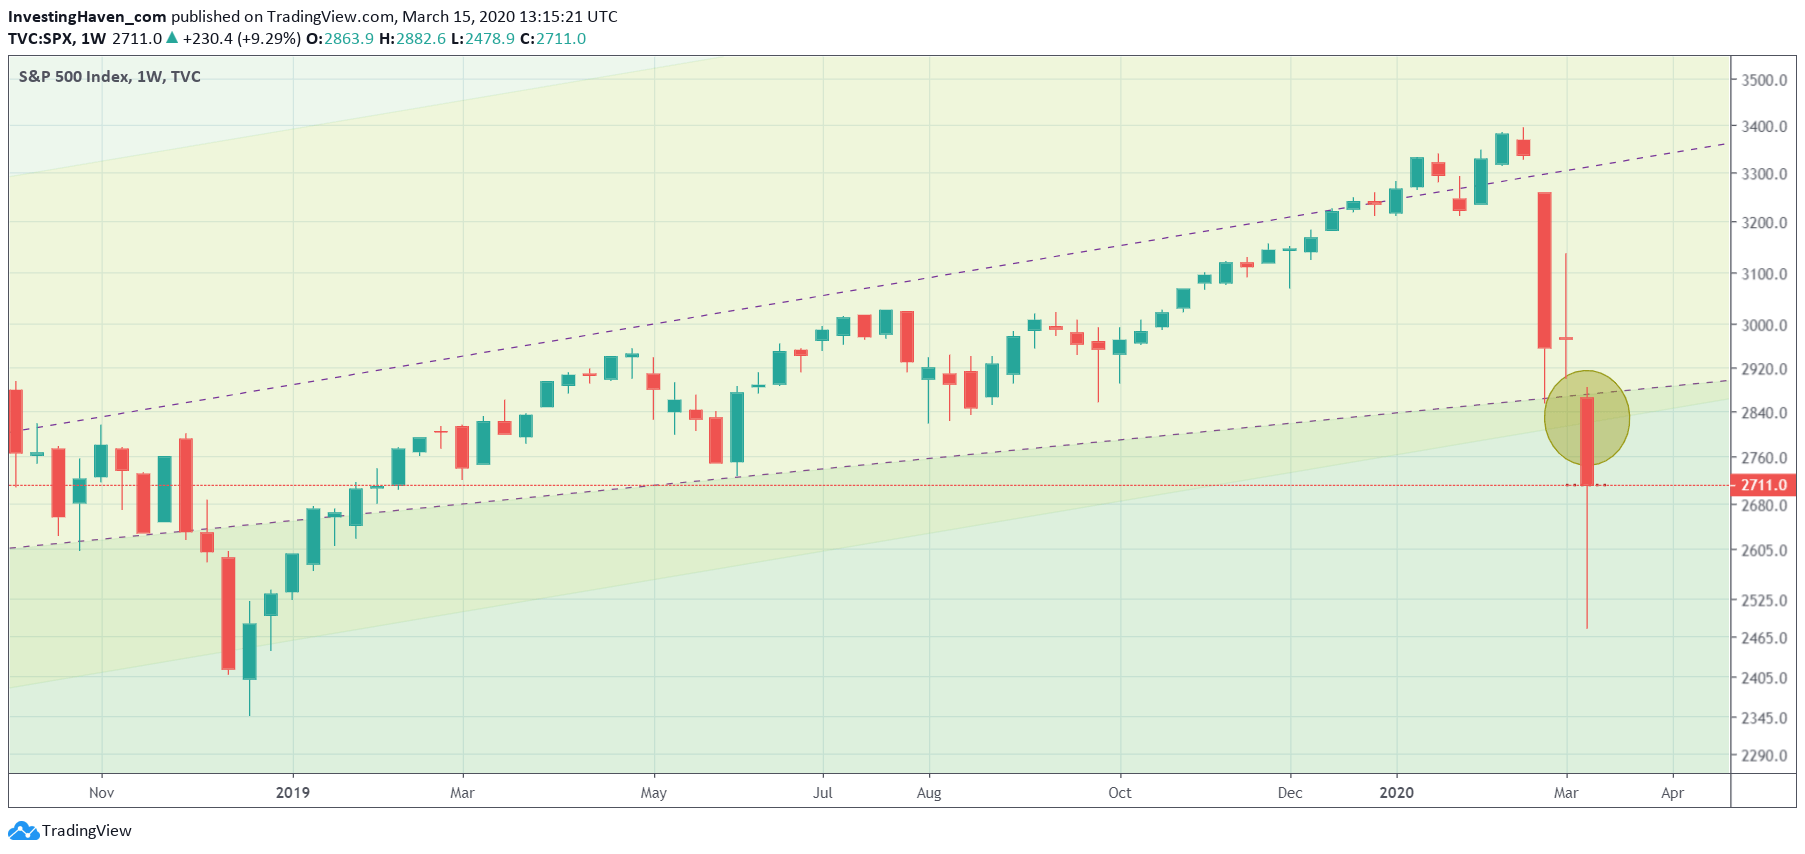
The next chart is a close up, on a weekly timeframe.
The crossing of the 2 lines mentioned above is clearly visible here. The S&P500 needs to get back to 2850 points to avoid a breakdown. This may or may not happen at the end of the month, we can expect everything from these crazy markets.

For now we can consider this a breakdown process in progress, until proven otherwise.


