The S&P 500 Index dropped once to its 200 day moving average (dma) in 2024. So far, its 200 dma provided strong support. Even in case the 200 dma will be tested, in 2024 and 2025, it will likely continue to provide support.
See related – Our 2025 market forecasts.
We are not too concerned, certainly not with hysteria around a market crash and economic recession. The data simply don’t suggest a crash nor recession are around the corner.
That said, if we look at the S&P 500 chart, we see a nice uptrend with ‘buy the dip’ characteristics.
The only drop in the S&P 500 to its 200 day moving average, in 2024, got bought immediately. This pattern will likely continue in 2024 and 2025. Even if the S&P 500 would drop below its 200 day moving average, it is likely to find solid support right below it, say in an area of 5 to 7 pct below its 200 dma.
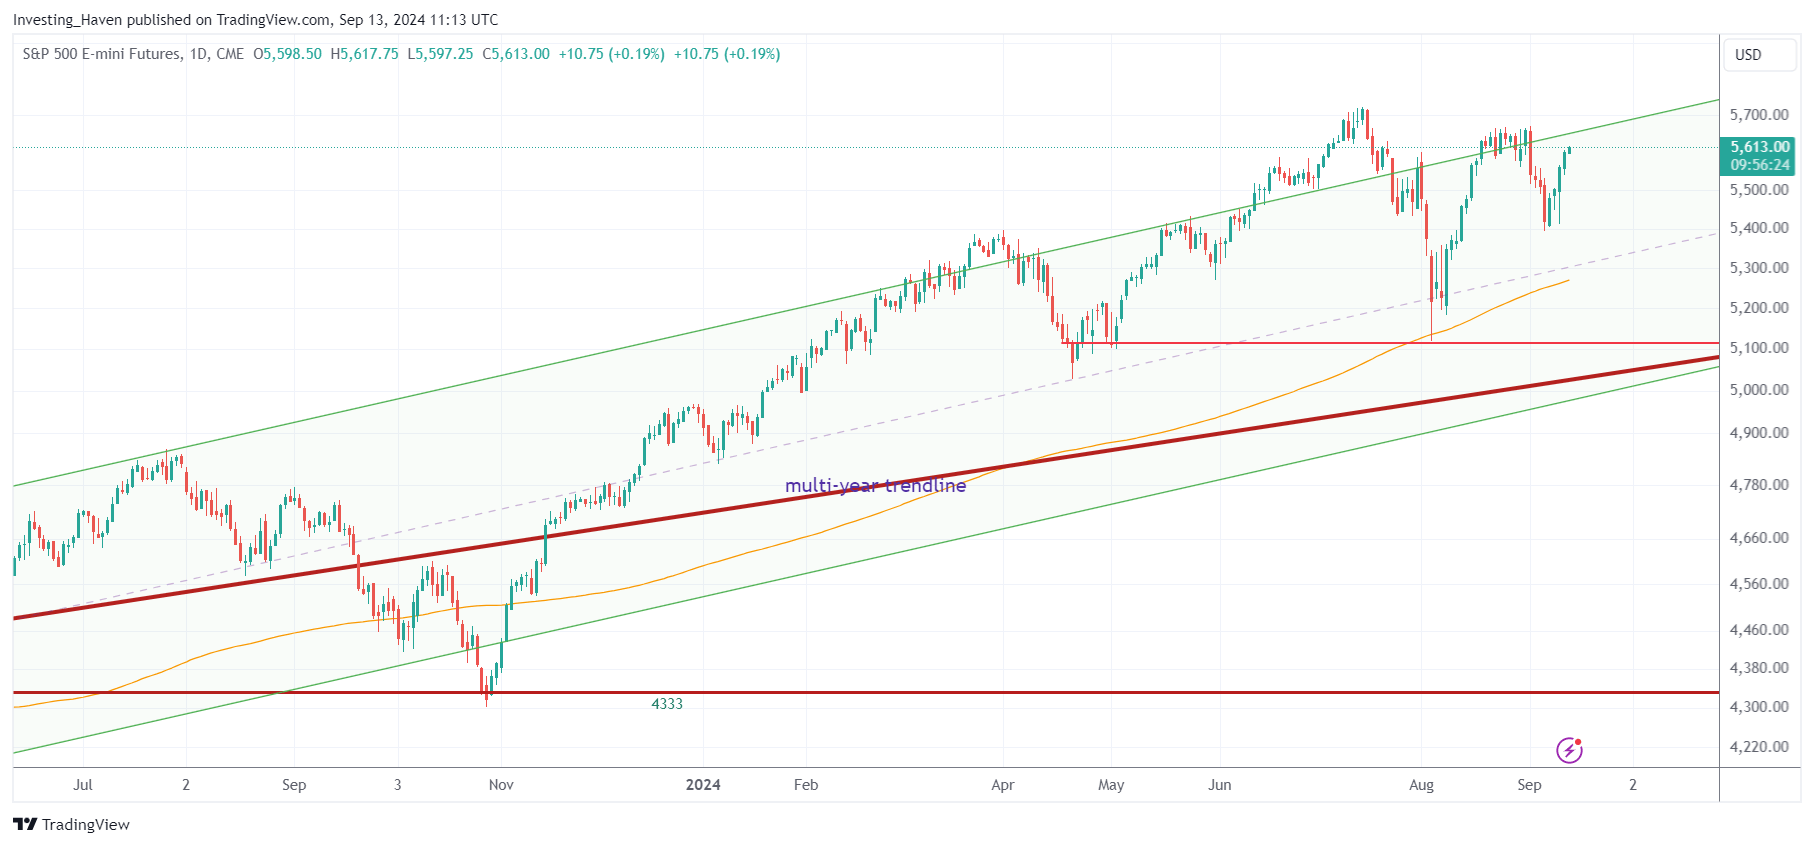
A few highlights from the S&P 500 chart, daily timeframe:
- The S&P 500 index is moving inside a rising channel (green shaded area). This is bullish until proven otherwise.
- While we do not care about moving averages, simply because all of them are lagging, it is ‘interesting’ to track them, more from an anecdotal point of view. A moving average like the 200 dma helps us look at the S&P 500 the way the majority of investors look at the market.
- In November 2023, the S&P 500 moved below its 200 dma, only for 8 days. Since then it has remained above it.
September 11th, 2024 – The big support areas on the S&P 500 chart are (1) the 200 dma (2) the bottom of the rising channel. This latter coincides with the support structure created in April and May 2024.
Do we believe that the S&P 500 will continue to find support at the 200 day moving average? Yes, we think so, but this has truly nothing to do with the 200 day moving average itself. As evidenced by our chart, above, highlighting our own annotations, the S&P 500 has a very strong support right below its 200 dma. Therefore, this area will likely hold in 2024 and 2025.


