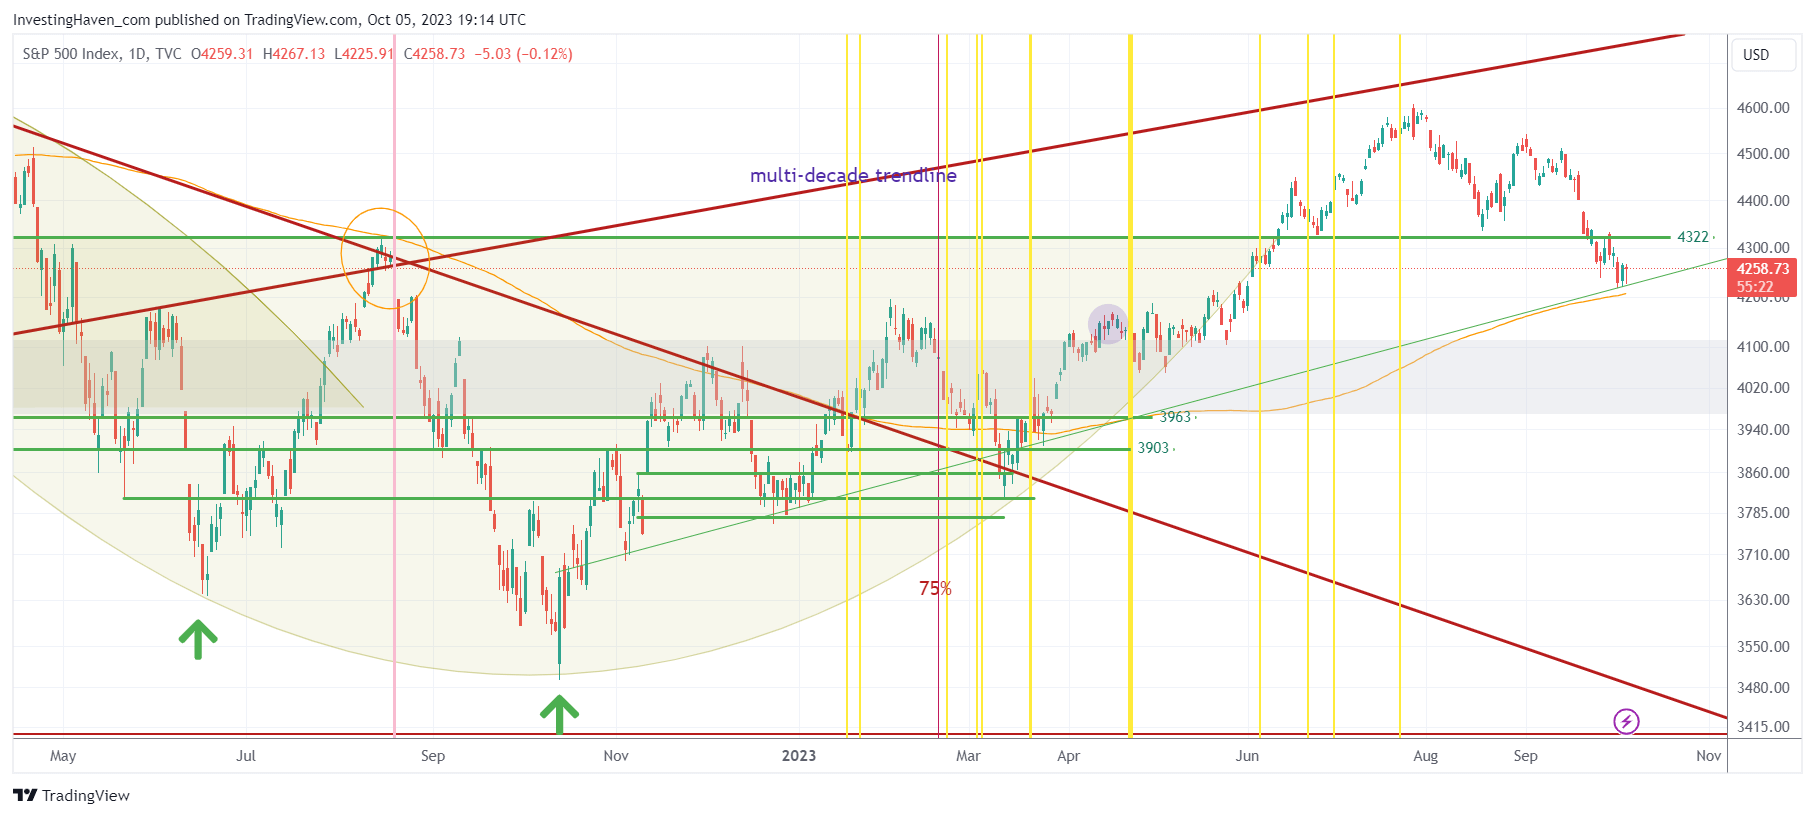
Two months ago, we signaled that the S&P 500 was close to touching its 40-year rising trendline as a resistance, a likely turning point. Ten days ago, we signaled the opposite: the S&P 500 was close to touching its 200 day moving average as support. This week, a week in which lead indicators are undergoing a turning point, the S&P 500 is inches away from its 200 dma. Moreover, leading indicators Yields and the USD seem to have found resistance. Market sentiment is bearish, this fear & greed indicator (an anecdotal indicator, not a leading indicator) signals extreme fear among investors. The perfect storm for a bullish turning point in broad markets. Yes, we believe that the S&P 500 will start rising in October 2023, this is why. What truly matters is that the data suggest that the S&P 500 will stop falling in October 2023 which is more important than the start and slope of the rise. Stocks will be attractive in the coming days, weeks, months.
Spotting turning points is not easy.
We wrote an article with practical tips on how to spot a turning point in the S&P 500 based on a study of 30 years of data: How To Know When The S&P 500 Confirms A Bullish Turning Point?
At this point in time, given the rising trendline of the S&P 500 since it bottomed about a year ago, we expect this index to find good support around this current level. Interestingly, the rising trendline coincides with the 200 dma.
As seen on below chart, the bullish breakout in the S&P 500 that started in the first week of June is now essentially back-tested. The chart setup suggests that the S&P 500 is able to start rising in October 2023, even though it might not be a runaway market.
The most likely path is some supportive price action, at least one (if not two) back-tests of the rising green trendline, after which the S&P 500 moves back to its July 2023 highs.
A secondary indicator that supports our “October bullish turning point thesis” or also “the S&P 500 will start rising in October 2023” is the bull/bear ratio. Sentiment data are contrarian indicators.
As seen, the number of bulls vs. bears has come down from 2.13 in the week of Sept 19th (the FOMC week) to 1.77 this week. While this is not an extreme reading, it certainly suggests there is enough fear to support a turning point in broad markets.
What is the challenge for stock market investors? Rotation, epic rotation. It is not easy to see which sector exactly will take off, and when sectors will start moving higher (or lower). That’s why we said repeatedly: be patient, pick sectors that are attractive from their long term growth prospects, stay focused on high growth companies.
We are preparing an alert, for our Momentum Investing members, in which we pick two candidates that will start strong momentum in the month of October (one AI-stock). Moreover, we feature a few lower risk stocks that have good upside potential in the coming months. Our alert will be sent not later than Sunday.


