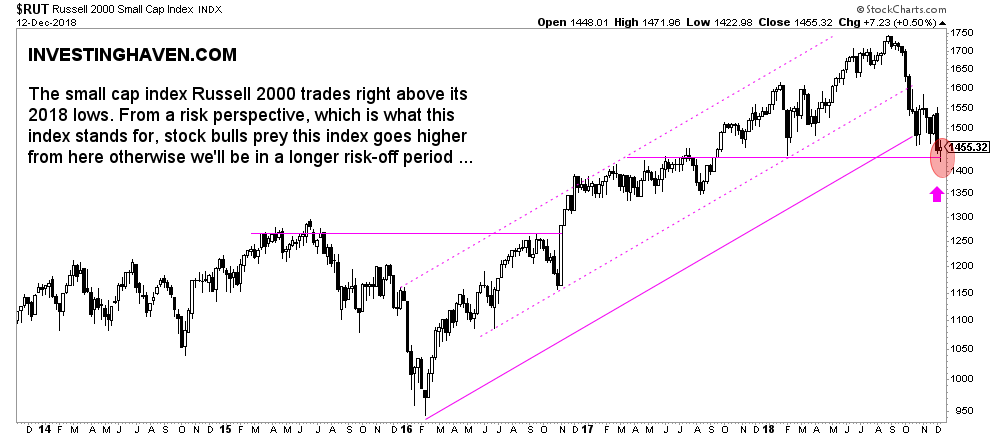
The recent stock market crash, or at least mini-crash, in recent 10 weeks, has turned stock market charts pretty ugly. We may have recently signaled a higher low in the 20 year Dow Jones long term chart (large caps) but we turn our attention to the small caps in this article. We have always considered small caps as the leading risk-on indicator for US stocks. Looking at the small caps chart it is clear that this index has to turn bullish pretty fast otherwise stocks will be in a sustained risk-off period. This is why stock bulls prey that small caps go higher as of the first day in 2019.
WSJ rightfully hints at small caps trades at the edges of a bear market. Yes there are many concerns out there, both on macro and micro economic level.
However, according to Bloomberg Jefferies is projecting the small cap index to finish 2019 at 1,550, implying a 5.7 percent gain. This qualifies below the average 9.2 percent annual return over the past 10 years.
At InvestingHaven, we tend to stick to the dominant trends visible on the charts, and look at things holistically from an intermarket dynamics perspective.
From that perspective we attach a lot of value to the Russell 2000 index, the small caps stand for ‘risk sentiment’ in US stocks. That’s why it is imperative for stock bulls to see a solid trend in the Russell 2000 chart.
The small cap index Russell 2000 trades right above its 2018 lows. From a risk perspective, which is what this index stands for, stock bulls prey this index goes higher from here otherwise we’ll be in a longer risk-off period …
The line in the sand is 1420 points in the small cap index. Stock bulls prey that the Russell 2000 trades above this level as of day one in 2019.


