Investing Haven
No Result
View All Result
Gold Silver Investing >>
CRYPTO INVESTING >>
  • 2025 Forecasts
    • 10 market predictions
    • Dow Jones forecast
    • S&P 500 forecast 2025
    • Nasdaq prediction 2025
    • Best altcoins to buy
    • Best crypto to buy now
    • Which crypto will explode
    • 15 crypto forecasts 2025
    • Which precious metal to buy
  • Silver
    • Silver prediction 2025 – 2030
    • Will silver exceed $30?
    • When will silver hit $50?
    • Can silver hit $100?
    • Silver shortage
    • 50-year silver chart
    • Silver bullish reversal
    • Silver seasonality charts
    • How to invest in silver
  • Gold
    • Gold prediction 2025 – 2030
    • Will gold set new ATH?
    • Will gold hit $3,000?
    • Can gold hit $10,000?
    • Gold chart 10 years
    • Gold chart 50 years
    • Gold chart 100 years
    • Gold silver ratio
    • Gold seasonality charts
  • Commodities
    • Coffee forecasts
    • Sugar forecasts
    • Nickel forecasts
    • Lithium investing
  • Crypto forecasts
    • BTC prediction 2025 – 2030
    • ETH prediction 2025 – 2030
    • SOL prediction 2025 – 2030
    • XRP prediction 2025 – 2030
    • XLM prediction 2025 – 2030
    • BNB prediction 2025 – 2030
    • ADA prediction 2025 – 2030
    • AVAX prediction 2025 – 2030
    • KAS prediction 2025 – 2030
    • NEAR prediction 2025 – 2030
    • BCH prediction 2025 – 2030
    • LINK prediction 2025 – 2030
    • DOT prediction 2025 – 2030
    • SUI prediction 2025 – 2030
    • ICP prediction 2025 – 2030
    • LTC prediction 2025 – 2026
    • STX prediction 2025 – 2030
    • DOGE prediction 2025 – 2030
    • SHIB prediction 2025 – 2030
    • PEPE prediction 2025 – 2030
    • FLOKI prediction 2025 – 2030
    • WIF prediction 2025 – 2030
    • ONDO prediction 2025 – 2030
  • News
    • Crypto news
    • Commodities
  • Login
Investing Haven
No Result
View All Result

Home » Markets & Stocks » Stock Market Turmoil In August 2019?

Stock Market Turmoil In August 2019?

Taki Tsaklanos by Taki Tsaklanos
August 11, 2019
in Markets & Stocks
crash stocks
2.1k
VIEWS
Share on FacebookShare on Twitter

Stocks were weak, and even saw a strong -3% sell off since the U.S. Fed lowered interest rates some 10 days ago. Is this the start of the next  stock market crash is what many are asking? Or, maybe not as extreme, but can we expect above average stock market turmoil in August of 2019? One potential clue can be found in our leading indicators, and the other one in our 100 investing tips. We also review how the 5 Shocking Charts From 1987 and Similarities with a Market Crash In 2019.

Note that what happened in the last ten days is a serious clean up in the camp of bulls, even to extreme levels. We recommend checking the bulls vs. bears chart (showing that bulls plummeted from 38% to 22% and bears literally doubled to 48% – most extreme levels since December) as well as this historic S&P 500 corrections chart (since 1990, the average year has seen 3.3 separate 5% pullbacks a year, for 2019 this was the second).

First of all, as said in our investing method, it is Treasury rates as well as the Euro that are leading indicators for stocks.

 All major moves in markets, especially market crashes, start with major turning points in credit and currency markets. That’s why 10 and 20 year rates, as well as leading currency pairs, have the most influence on all other markets, including stock markets around the globe.

What does this mean?

That investors do NOT have to check all the stock market indexes. The answer to our question “Is this the start of the next  stock market crash is what many are asking? Or, maybe not as extreme, but can we expect above average stock market turmoil in August of 2019?” does not come from the charts WITHIN the stock market, but from charts OUTSIDE of the stock market.

Counter intuitive?

Maybe, but not when taking intermarket dynamics into account. In the end all capital in almost a finite ‘body’ so capital simply flows from one asset (class) to another asset (class) in its never ending search for profits.

The one chart that may have an answer to the question we are looking for is the Euro. As said Currency Market Writes History: Why Is The Euro Flat For 12 Months the Euro chart is flat, flat, flat. It did not change in the last weeks.

No, the Euro has not the answer we are looking for.

What about Treasury rates?

Different story, as this is the source of the turmoil we have seen lately.

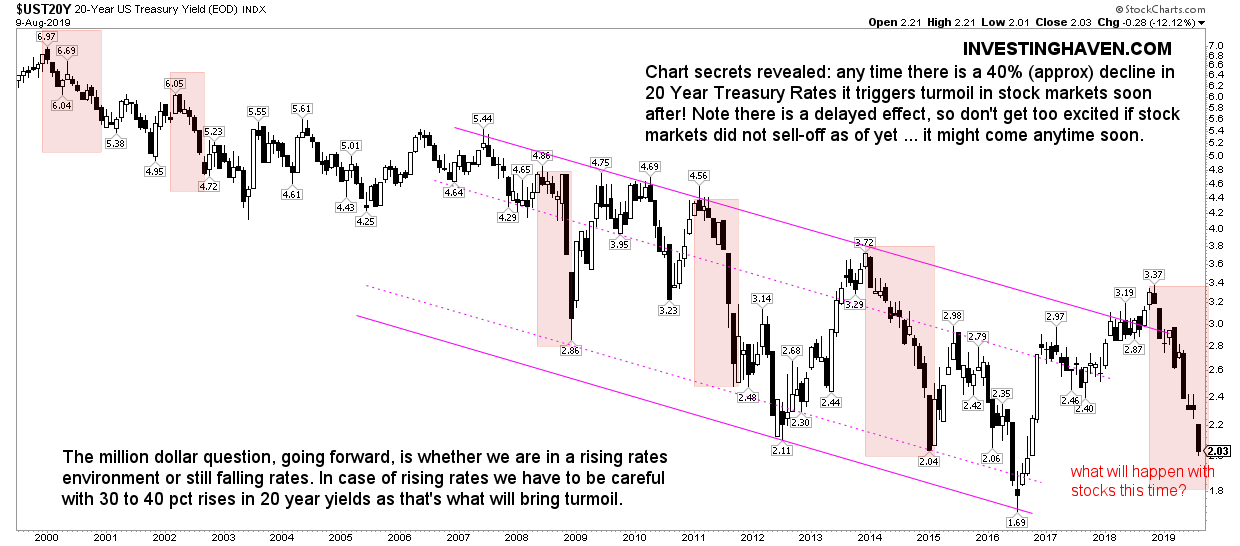
The 20 year rates chart, embedded in this article, shows what a crash took place in credit markets. This is serious, it really is. It’s an almost 50% decline in rates only in 2019!

Our rule of thumb is the 30 to 40 pct declines in rates result in shockwaves across global markets.

So we have two questions to solve:

  1. Is there more downside, as in how bad can it get? The answer is that we are near rock solid bottoms, at least for the short and medium term. We see another 10% downside to 1.8 in 20 year Treasuries.
  2. What is the effect of an almost 50% decline? This may be serious! On the one hand we do NOT see a similar big move in leading currencies, which is the good news. If the Euro would have crashed we would have flashed a big SELL on all stocks! That’s not the case now!

What is happening probably is this massive flight into Treasuries, a safe haven. There is serious capital flowing out of stocks into bonds, hence the falling rates.

As the Euro remains stable we believe there will be no serious impact on stocks and other markets. This remains to be confirmed though, so we may come in a high alert state but we don’t believe so.

We don’t see similar effects as in 1987, with Black Monday, when both rates and the USD went through a big, big move a few months for the stock market crash. This is subject to change, and we keep a very, very close eye on this!

[Ed. note: As of this week we will provide in-depth analysis to our ‘free newsletter’ subscribers. We will bring premium content with specific investing tips on a weekly basis, mid-week, free of charge. We will do this for 4 months. Subscribe to our free newsletter and get premium investing insights in 2019 for free.]

20 year yields vs stock market turmoil

10-YEAR ANNIVERSARY OFFER: InvestingHaven.com celebrates 10 years. Temporarily, you can enjoy a discount on our premium gold/silver and crypto reports. Or you can become a VIP member. Go to our anniversary deals >>
Receive our weekly newsletter.

premium service SP-500 premium service trade alerts premium service crypto teaser 

No related posts.

Tags: Chart Secrets
Taki Tsaklanos

Taki Tsaklanos

Taki has +15 years of experience in global markets. He is passionate about forecasting markets - he calls it THE ART OF FORECASTING. His analysis methodology is unique and effective, yet easy to understand; it is based on chart analysis combined with intermarket / fundamental / sentiment analysis. His work appeared on major financial outlets like FinancialSense, MarketWatch,Twitter: twitter.com/investinghaven

Connect with InvestingHaven

Receive top notch forecasts for free.

*We hate spam as you do.

Site Navigation

  • RSS Feed
  • About us
  • Advertising
  • Sponsored Content Policy
  • Mission 2026
  • Sitemap
  • Privacy & Disclaimer
  • Terms of Service
  • Contact Us
investing haven logo

Precious metals market analysis including gold and silver price predictions. Crypto market analysis including highly accurate BTC ETH SOL XRP forecasts.

Copyright © 2025 InvestingHaven

Login to your account below

Forgotten Password?

Fill the forms bellow to register

All fields are required. Log In

Retrieve your password

Please enter your username or email address to reset your password.

Log In

Receive top notch forecasts for free.

*We hate spam as you do.

No Result
View All Result
  • News
  • 2025 Forecasts
    • 10 market predictions
    • Dow Jones forecast 2025
    • S&P 500 forecast 2025
    • Nasdaq prediction 2025
    • Best crypto to buy now
    • Which crypto will explode
    • Best altcoins to buy
    • 15 crypto forecasts 2025
    • Which precious metal to buy
  • Silver articles
    • Silver prediction 2025 – 2030
    • Will silver exceed $30?
    • When will silver hit $50?
    • Can silver hit $100?
    • Silver shortage
    • 50-year silver chart
    • Silver bullish reversal
    • Silver seasonality charts
    • How to invest in silver
  • Gold
    • Gold prediction 2025 – 2030
    • Will gold set new ATH?
    • Will gold hit $3,000?
    • Can gold hit $10,000?
    • Gold chart 10 years
    • Gold chart 50 years
    • Gold chart 100 years
    • Gold silver ratio
    • Gold seasonality charts
  • Commodities
    • Sugar forecasts
    • Coffee forecasts
    • Nickel forecasts
    • Lithium investing
  • Crypto news
  • Crypto forecasts
    • BTC prediction 2025 – 2030
    • ETH prediction 2025 – 2030
    • SOL prediction 2025 – 2030
    • XRP prediction 2025 – 2030
    • XLM prediction 2025 – 2030
    • BNB prediction 2025 – 2030
    • ADA prediction 2025 – 2030
    • AVAX prediction 2025 – 2030
    • KAS prediction 2025 – 2030
    • NEAR prediction 2025 – 2030
    • BCH prediction 2025 – 2030
    • LINK prediction 2025 – 2030
    • DOT prediction 2025 – 2030
    • SUI prediction 2025 – 2030
    • ICP prediction 2025 – 2030
    • LTC prediction 2025 – 2026
    • STX prediction 2025 – 2030
    • DOGE prediction 2025 – 2030
    • SHIB prediction 2025 – 2030
    • PEPE prediction 2025 – 2030
    • FLOKI prediction 2025 – 2030
    • WIF prediction 2025 – 2030
    • ONDO prediction 2025 – 2030
  • Premium Crypto Alerts
  • Premium services

Copyright © 2025 InvestingHaven