We have explained many times in the past why the Euro deserves a top spot in anyone’s market analysis methodology. The short version: it is a leading indicator for global markets, some sort of ‘risk on’ barometer. The long version is explained in articles published on this blog, see tags EUR and EURO.
This is what we wrote back in May in Leading Risk Indicator EURO Eager To Confirm A New Secular Bull Market
What the Euro charts tell us is that stocks in general, but primarily commodities will do well in the long run. Validation of this thesis: Euro must continue to close above 1.20 points in the next 3 to 5 months.
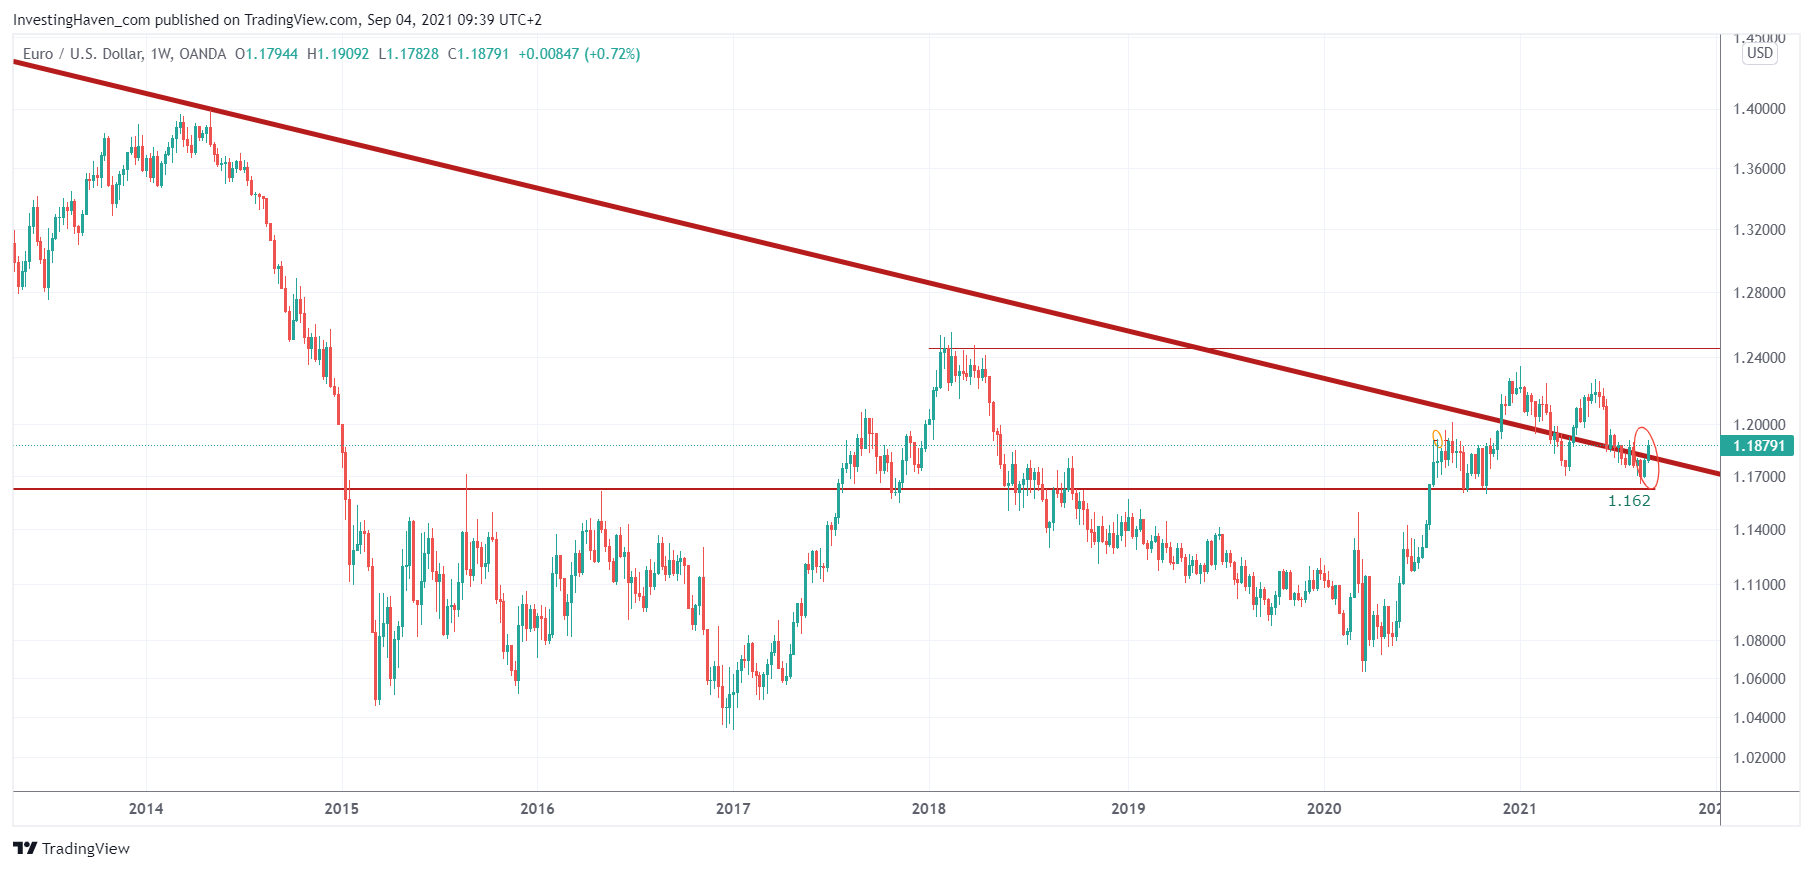
April of 2021 came to an end we see that the Euro printed a good closing price. Slightly higher would have been better, but the point is that the Euro closed above the 12 year falling trendline.
The Euro is flirting for 9 months now with a 12 year falling trendline. How to interpret this? Above this falling trendline the Euro wants to be bullish (3 month closing price above this trendline is required as a confirmation), and turn a 12 year bear market into a new bull market.
This turn from bearish to bullish comes with major implications for markets. A rising Euro has an inflationary effect on markets, which implies that stocks and commodities tend to rise.
After a few months of flirting with this 12 year trendline we now see an attempt of the Euro to get back above it. While there was a potential bearish M-pattern in the making, we believe that (a) the fact that 1.162 was respected (b) the Euro is rising above this trendline implies that stocks have still more upside. That’s not necessarily in the very short term, but longer term (directionally).


