Investing Haven
No Result
View All Result
Gold Silver Investing >>
CRYPTO INVESTING >>
  • 2025 Forecasts
    • 10 market predictions
    • Dow Jones forecast
    • S&P 500 forecast 2025
    • Nasdaq prediction 2025
    • Best altcoins to buy
    • Best crypto to buy now
    • Which crypto will explode
    • 15 crypto forecasts 2025
    • Which precious metal to buy
  • Silver
    • Silver prediction 2025 – 2030
    • Will silver exceed $30?
    • When will silver hit $50?
    • Can silver hit $100?
    • Silver shortage
    • 50-year silver chart
    • Silver bullish reversal
    • Silver seasonality charts
    • How to invest in silver
  • Gold
    • Gold prediction 2025 – 2030
    • Will gold set new ATH?
    • Will gold hit $3,000?
    • Can gold hit $10,000?
    • Gold chart 10 years
    • Gold chart 50 years
    • Gold chart 100 years
    • Gold silver ratio
    • Gold seasonality charts
  • Commodities
    • Coffee forecasts
    • Sugar forecasts
    • Nickel forecasts
    • Lithium investing
  • Crypto forecasts
    • BTC prediction 2025 – 2030
    • ETH prediction 2025 – 2030
    • SOL prediction 2025 – 2030
    • XRP prediction 2025 – 2030
    • XLM prediction 2025 – 2030
    • BNB prediction 2025 – 2030
    • ADA prediction 2025 – 2030
    • AVAX prediction 2025 – 2030
    • KAS prediction 2025 – 2030
    • NEAR prediction 2025 – 2030
    • BCH prediction 2025 – 2030
    • LINK prediction 2025 – 2030
    • DOT prediction 2025 – 2030
    • SUI prediction 2025 – 2030
    • ICP prediction 2025 – 2030
    • LTC prediction 2025 – 2026
    • STX prediction 2025 – 2030
    • DOGE prediction 2025 – 2030
    • SHIB prediction 2025 – 2030
    • PEPE prediction 2025 – 2030
    • FLOKI prediction 2025 – 2030
    • WIF prediction 2025 – 2030
    • ONDO prediction 2025 – 2030
  • News
    • Crypto news
    • Commodities
  • Login
Investing Haven
No Result
View All Result

Home » Markets & Stocks » This Leading Indicator Loses Bullish Structure, Now Very Vulnerable

This Leading Indicator Loses Bullish Structure, Now Very Vulnerable

Taki T. by Taki T.
May 14, 2023
in Markets & Stocks
volatility
1.9k
VIEWS
Share on FacebookShare on Twitter

One of our leading indicators lost its bullish structure, as said last week in Small Caps Not In A Great Spot To Weather A Mid-Cycle Turning Point. It is now vulnerable which is not the same as ready to start a market crash. As long as the 2022 lows are respected, on a 3 to 5 day closing basis, it is signaling a continuation of the consolidation. This latter scenario would set the stage of a summer rally, which is one of our 2023 forecasts.

Analyzing the Russell 2000 chart is of utmost importance for investors and chartists, as it serves as a valuable momentum indicator and a leading signal for the broader stock market. This index provides insights into whether momentum is accelerating (bullish) or decelerating (bearish), guiding investors on potential opportunities or risks. The significance of studying the Russell 2000 chart lies in its ability to signal turning points and trend reversals, offering valuable clues for market participants.

The Russell 2000 chart since its peak in November 2021 reveals a deteriorating pattern, causing concerns about its bullish structure. As a leading indicator, the index’s weakness may imply broader market vulnerabilities. Understanding the interplay between the Russell 2000 and the overall market is crucial for investors seeking to stay ahead of potential market shifts.

Analyzing the Russell 2000’s Chart Structure and Historical Influence

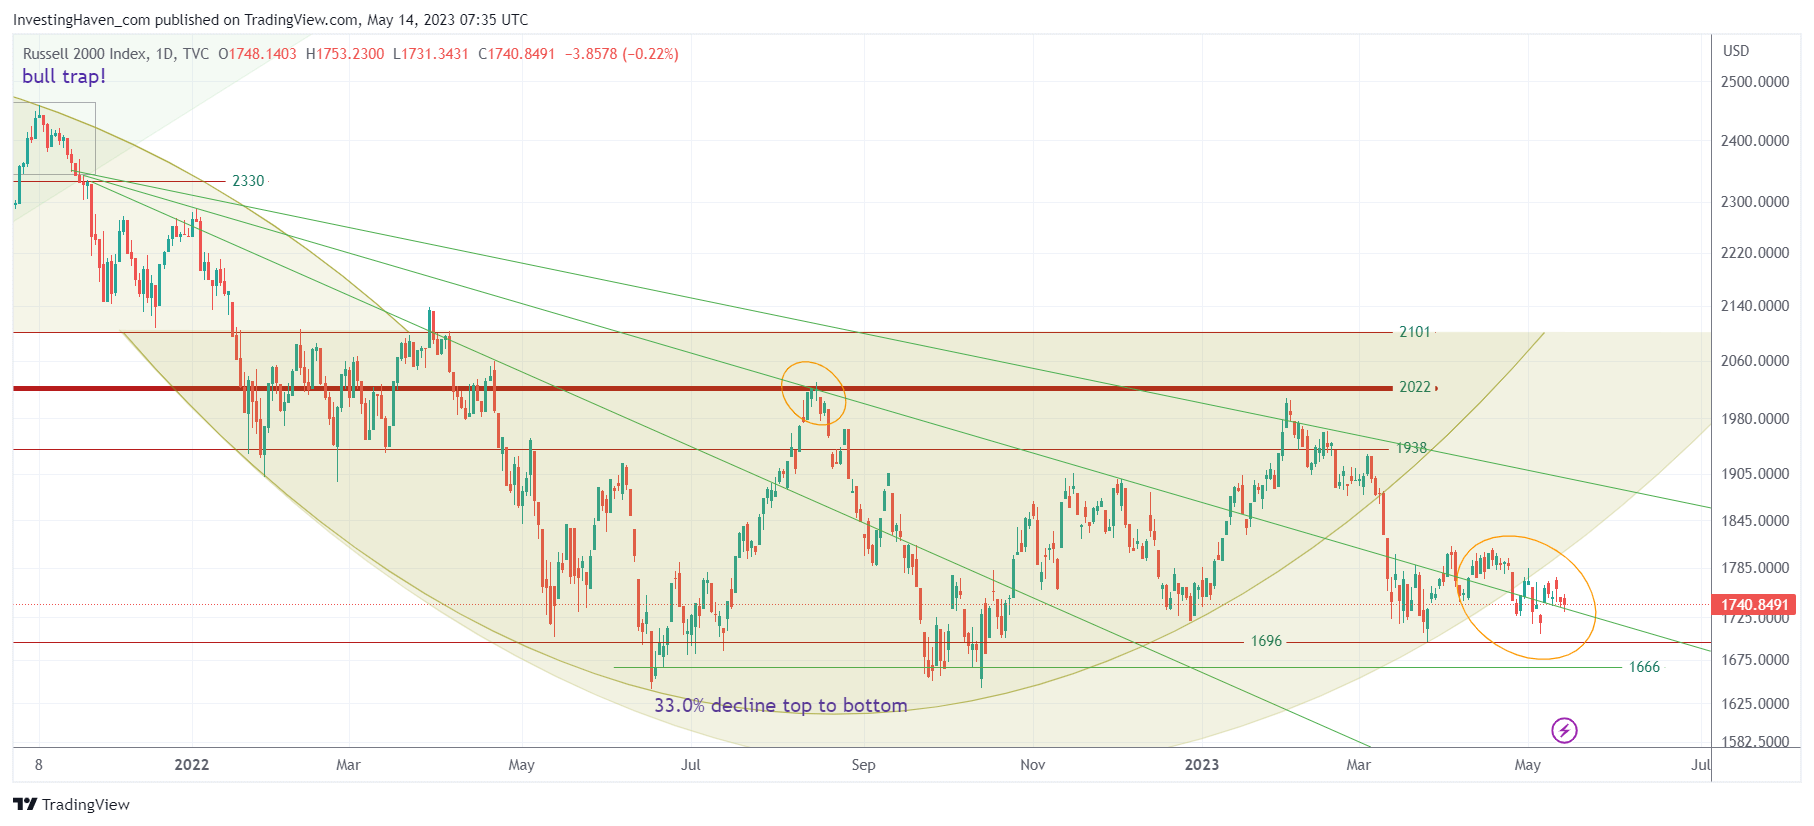
The current chart pattern of the Russell 2000 indicates a significant development: the breach of the rounded pattern on May 1st. This breach suggests a loss of bullish momentum, potentially leading to further downside pressure. Additionally, the presence of three prominent falling trendlines underscores the importance of these levels in shaping the index’s direction. These trendlines have exerted substantial influence over the Russell 2000 since last summer, serving as crucial support and resistance levels.

Looking ahead, a critical factor to monitor is the behavior of the 2022 lows. The upcoming tests in May and June will play a crucial role in determining the index’s trajectory. It is anticipated that the May test will hold, reflecting a temporary pause in the downward momentum. However, the outcome of the June test will depend heavily on the actions of officials and policymakers.

The influence of officials and politicians on market trends is an unfortunate reality in today’s financial landscape. Decisions regarding the debt ceiling and the policies set forth by the Federal Reserve will significantly impact market sentiment and direction. This heavy reliance on external factors highlights the delicate balance between market forces and the actions of those in power.

Conclusion

In conclusion, the Russell 2000 chart’s loss of its bullish structure raises concerns about the vulnerability of this index and potentially the broader market. As a leading indicator, its performance offers valuable insights for investors and chartists seeking to navigate the ever-changing market landscape. The breach of the rounded pattern and the prominence of falling trendlines underscore the importance of key support and resistance levels.

Moving forward, close attention should be paid to the upcoming tests of the 2022 lows in May and June. The outcome of these tests, coupled with the actions of officials and policymakers, will shape the market’s trajectory in the near term. While the influence of officials on market trends is regrettable, investors must stay vigilant and adapt their strategies accordingly to mitigate risks and capitalize on opportunities.

russell 2000 leading indicator

10-YEAR ANNIVERSARY OFFER: InvestingHaven.com celebrates 10 years. Temporarily, you can enjoy a discount on our premium gold/silver and crypto reports. Or you can become a VIP member. Go to our anniversary deals >>
Receive our weekly newsletter.

premium service SP-500 premium service trade alerts premium service crypto teaser 

No related posts.

Tags: Dow Jones chartsNASDAQNYSERUSSELL2000SPX
Taki T.

Taki T.

Taki is a chart analyst who is passionate about unlocking unique insights out the chart. While the vast majority of analysts remain focused on price analysis, Taki starts with timeline analysis and adds price analysis to this. In doing so, he developed a unique methodology to find opportunities in financial markets, across assets and markets.

Connect with InvestingHaven

Receive top notch forecasts for free.

*We hate spam as you do.

Site Navigation

  • RSS Feed
  • About us
  • Advertising
  • Sponsored Content Policy
  • Mission 2026
  • Sitemap
  • Privacy & Disclaimer
  • Terms of Service
  • Contact Us
investing haven logo

Precious metals market analysis including gold and silver price predictions. Crypto market analysis including highly accurate BTC ETH SOL XRP forecasts.

Copyright © 2025 InvestingHaven

Login to your account below

Forgotten Password?

Fill the forms bellow to register

All fields are required. Log In

Retrieve your password

Please enter your username or email address to reset your password.

Log In

Receive top notch forecasts for free.

*We hate spam as you do.

No Result
View All Result
  • News
  • 2025 Forecasts
    • 10 market predictions
    • Dow Jones forecast 2025
    • S&P 500 forecast 2025
    • Nasdaq prediction 2025
    • Best crypto to buy now
    • Which crypto will explode
    • Best altcoins to buy
    • 15 crypto forecasts 2025
    • Which precious metal to buy
  • Silver articles
    • Silver prediction 2025 – 2030
    • Will silver exceed $30?
    • When will silver hit $50?
    • Can silver hit $100?
    • Silver shortage
    • 50-year silver chart
    • Silver bullish reversal
    • Silver seasonality charts
    • How to invest in silver
  • Gold
    • Gold prediction 2025 – 2030
    • Will gold set new ATH?
    • Will gold hit $3,000?
    • Can gold hit $10,000?
    • Gold chart 10 years
    • Gold chart 50 years
    • Gold chart 100 years
    • Gold silver ratio
    • Gold seasonality charts
  • Commodities
    • Sugar forecasts
    • Coffee forecasts
    • Nickel forecasts
    • Lithium investing
  • Crypto news
  • Crypto forecasts
    • BTC prediction 2025 – 2030
    • ETH prediction 2025 – 2030
    • SOL prediction 2025 – 2030
    • XRP prediction 2025 – 2030
    • XLM prediction 2025 – 2030
    • BNB prediction 2025 – 2030
    • ADA prediction 2025 – 2030
    • AVAX prediction 2025 – 2030
    • KAS prediction 2025 – 2030
    • NEAR prediction 2025 – 2030
    • BCH prediction 2025 – 2030
    • LINK prediction 2025 – 2030
    • DOT prediction 2025 – 2030
    • SUI prediction 2025 – 2030
    • ICP prediction 2025 – 2030
    • LTC prediction 2025 – 2026
    • STX prediction 2025 – 2030
    • DOGE prediction 2025 – 2030
    • SHIB prediction 2025 – 2030
    • PEPE prediction 2025 – 2030
    • FLOKI prediction 2025 – 2030
    • WIF prediction 2025 – 2030
    • ONDO prediction 2025 – 2030
  • Premium Crypto Alerts
  • Premium services

Copyright © 2025 InvestingHaven