Indexes are ‘just’ 15% to 25% below their ATH. That’s not great, but it does not represent the carnage that is ‘created under the hood’. Many stocks are at or below their Corona crash lows. Believe it or not, the stock market is full of horror stories. No surprise, sentiment among investors as not been as bearish in the last 40 years. It was exactly 40 years ago when bearish sentiment was a strong as it is today.
Let’s make this article visual. A few visuals tell so much more than a few thousands of words.
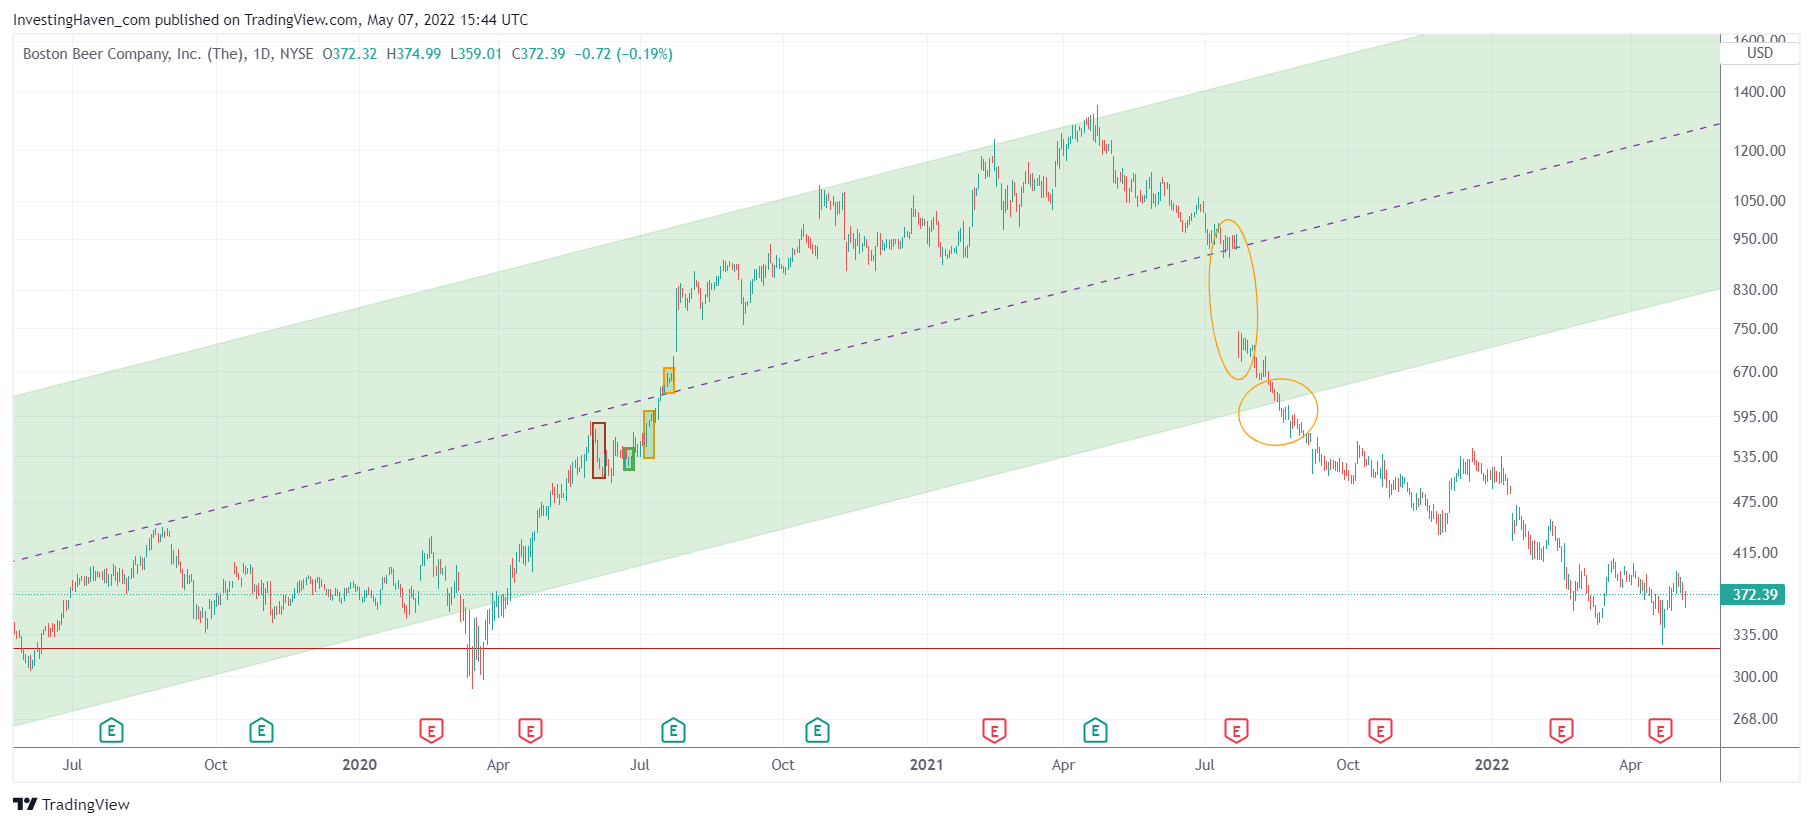
Boston Beer Company (SAM) came down 75% and is right above its Corona crash lows. Financially, this company had a negative EPS in recent quarters. Revenue was down in Q4/2021 but strongly up in Q1/2022. There is a lot of work until 2021 investors can recover, IF they will ever recover.
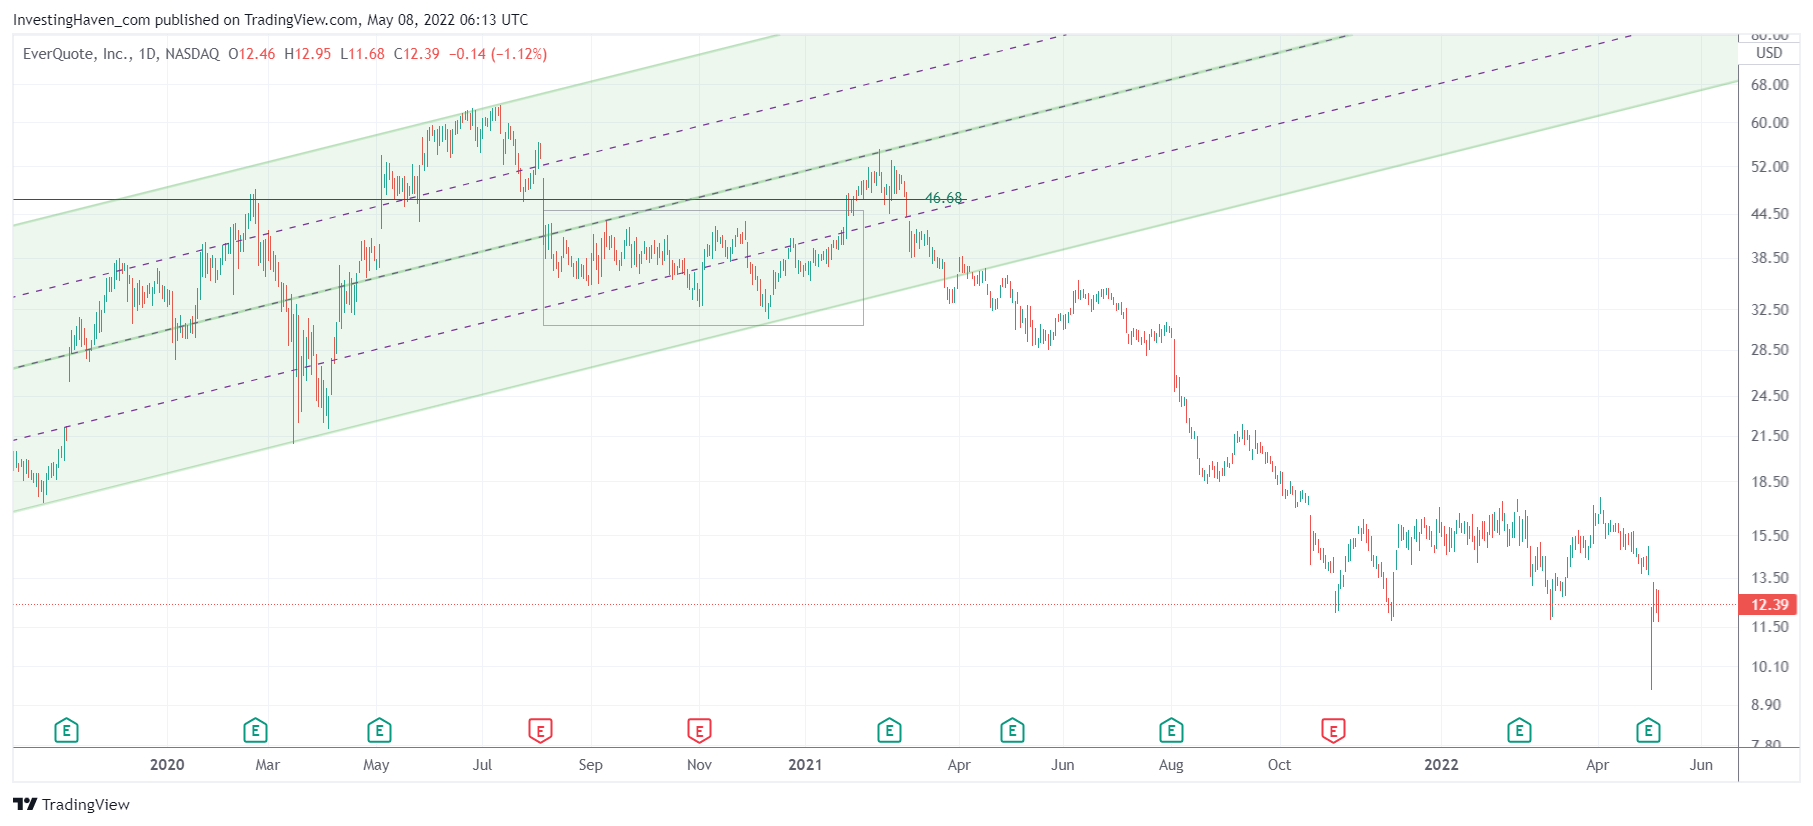
SAM is not the only horror story in markets. Here is EVER, an insurance company focused on selling online (pretty special in the insurance sector). Same story, earnings were not good, revenue not bad although a bit of a rollercoaster. Top to bottom EVER lost 88% in 24 months.
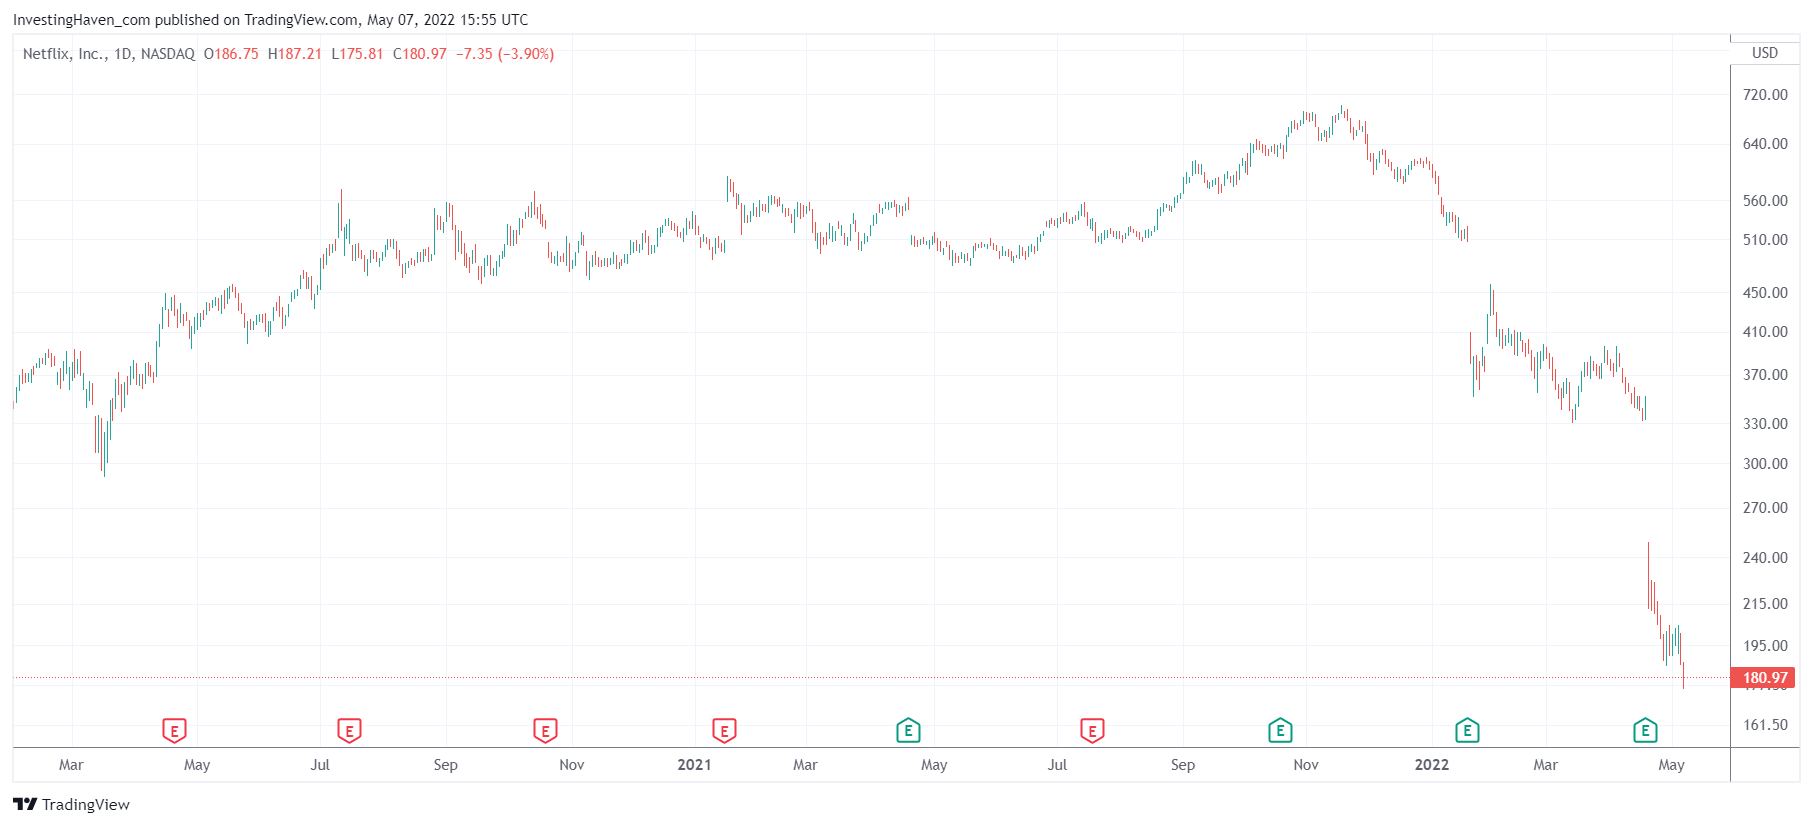
You might think that these horror stories are exclusive to small or mid cap stocks. What about Netflix, a big cap with a market cap north of 0.5 trillion at Thanksgiving last year? No comment.
So, then why are indexes down ‘only’ 15 to 25 pct? In the end, the carnage we notice is 60 to 80 pct in individual stocks?
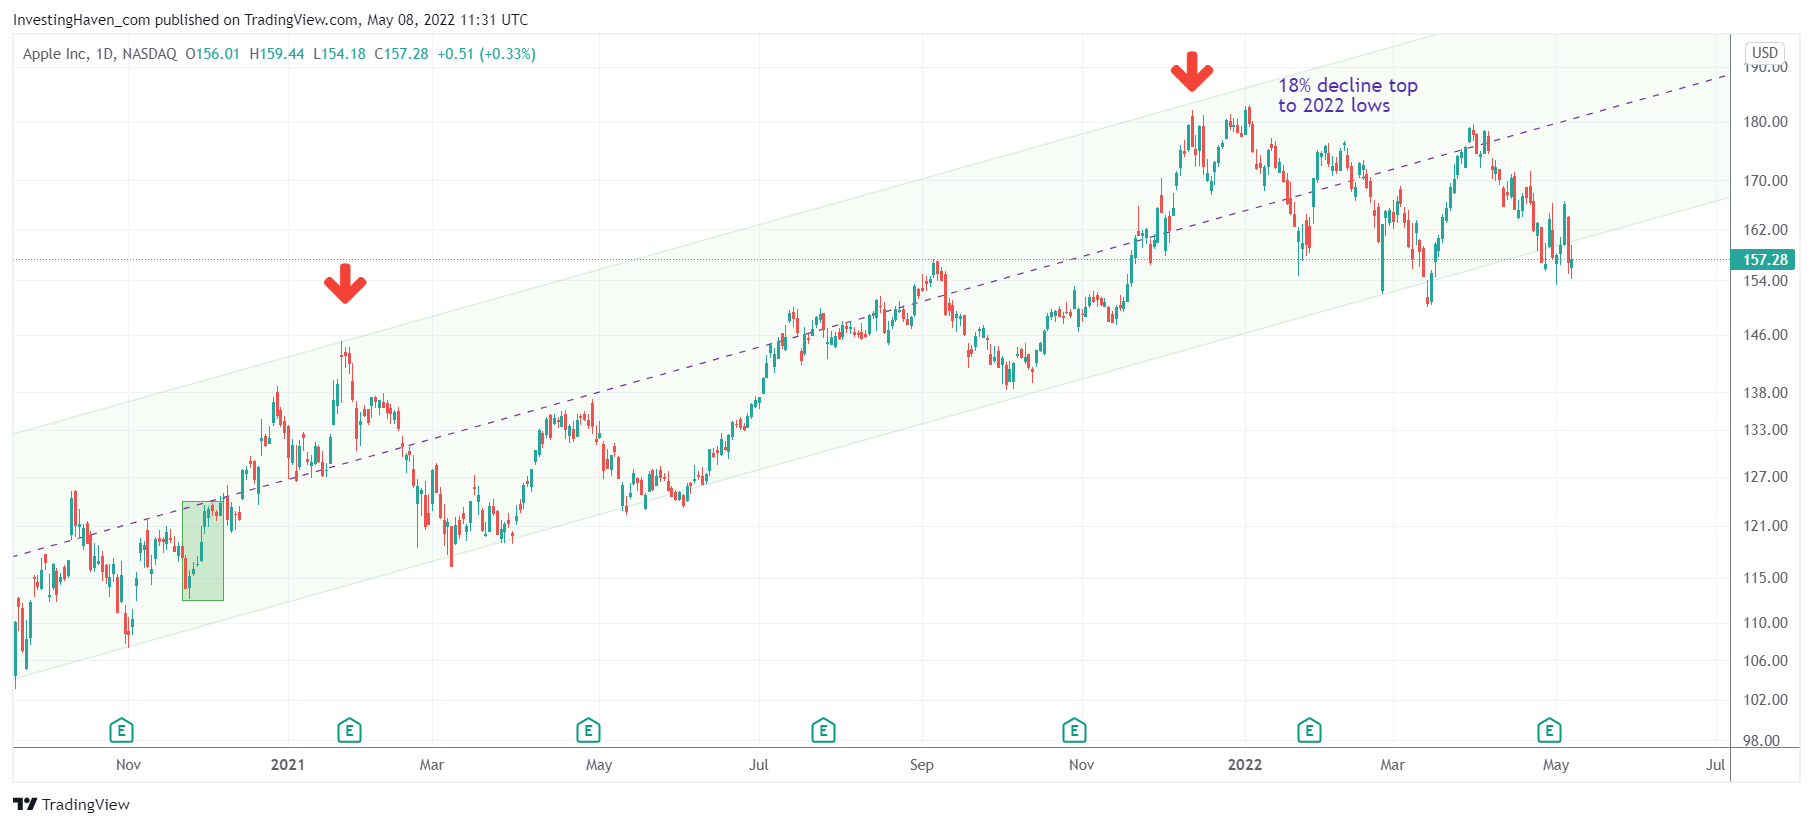
Here is the answer: the top holdings in the Nasdaq and S&P 500, all of them big cap tech stocks, are not hit as hard. We have to be more precise: several of them were not hit hard, think Apple, Microsoft and Tesla. Some others were hit harder, think Facebook (Meta). But, overall, the damage was ‘contained’.


