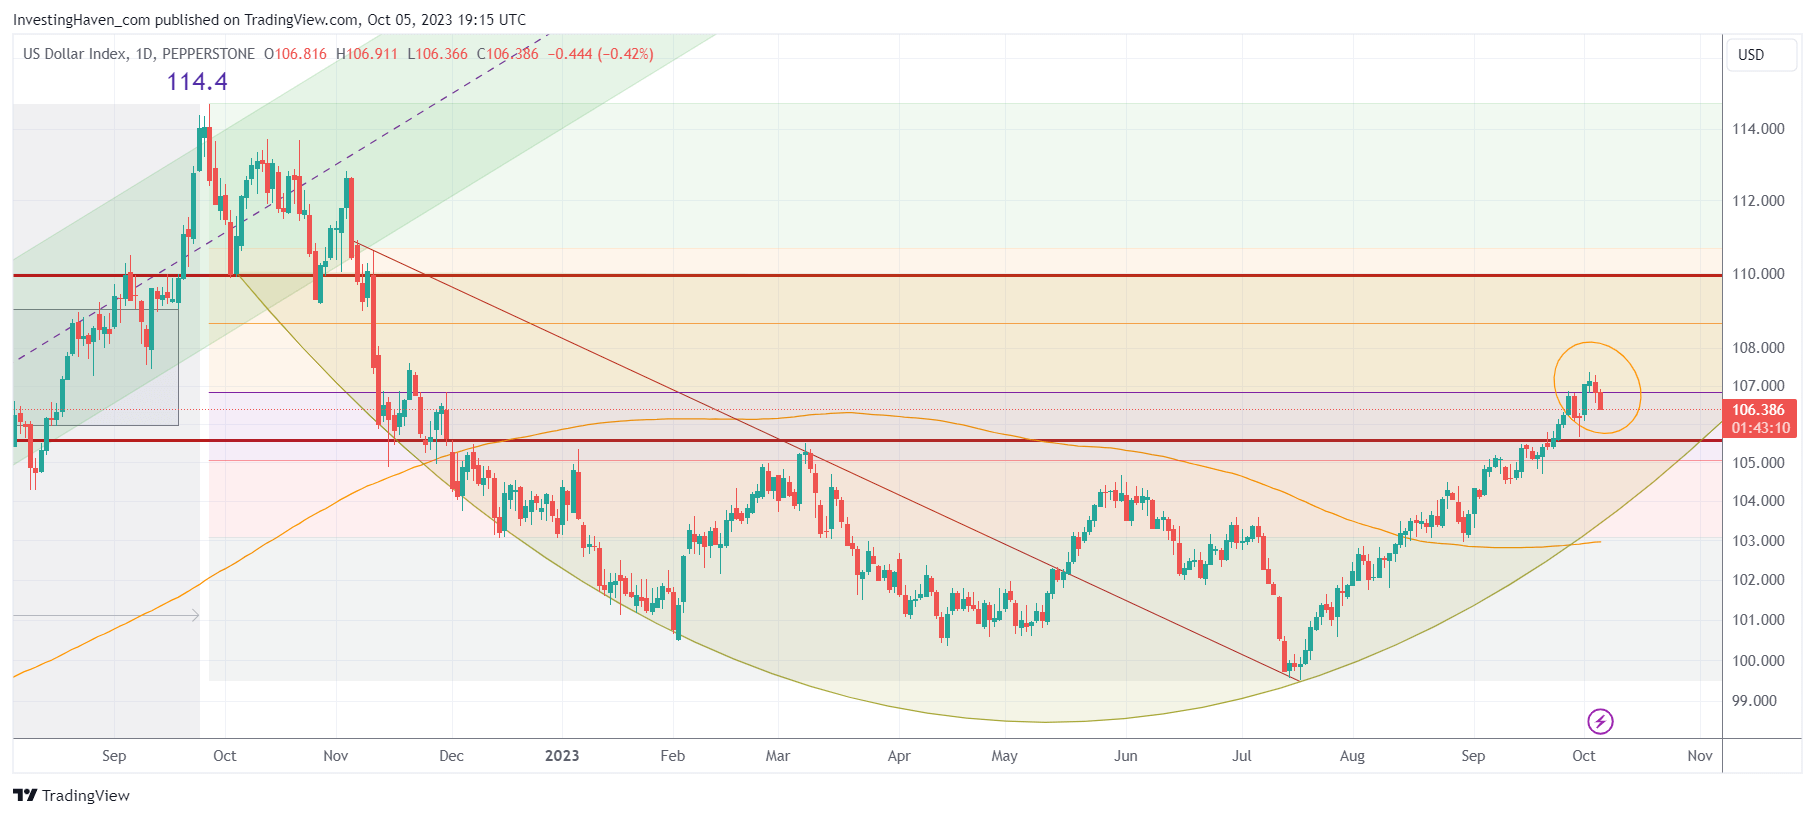
The US Dollar index should confirm resistance at 107 points over the course of next week. The rule of thumb is very simple: any market, any stock, any asset, including the USD index, require 3 to 5 daily candles without touching a level in order to confirm resistance or support. The USD index will need to remain below 107 next week to confirm that it found resistance there. Why is this important? Because it’s a leading indicator for markets & metals (gold & silver first and foremost).
The USD index is one of the leading indicators we closely follow. A strong rally in the USD is capable of pushing markets & metals lower. Since mid-July, the USD index went from 99.5 points to 107.5 points (Tuesday, October 3d, 2023). Consequently, stocks pulled back, gold pulled back, silver experienced a strong sell-off last Friday & Monday.
The important question is whether the USD is hitting resistance. If so, we should see evidence of a turning point which should bring relief in both markets and metals.
We already mentioned signs of that the S&P 500 will start rising on October 2023. The USD chart below provides more compelling evidence.
By far, the most important observation on this chart is the critical 50% retracement level which is always a level that comes with resistance. In this particular case, the 107-108 area was an obvious target for the USD as it coincided with the lower part of the reversal structure (candle structure created in November 2022).
We expect the USD index to fall to support of its 12-month rounded structure, around 104.5 points, in the coming weeks, where it waits an an important test.
In the meantime, we believe that silver is printing a bottom, with super bullish leading indicators like the CoT report. Hard to believe but true: this might be the last chance to get in before silver moves to our long-standing bullish target(s). The best entries are always there when it feels very uncertain and uncomfortable, always.


