The U.S. dollar was very bullish in the last quarter of last year. Treasury yields rose sharply, and so did the U.S. dollar. We wrote before that we became very bullish on the dollar once we noticed that it broke out: US Dollar Breaks Out To A New Bull Market.
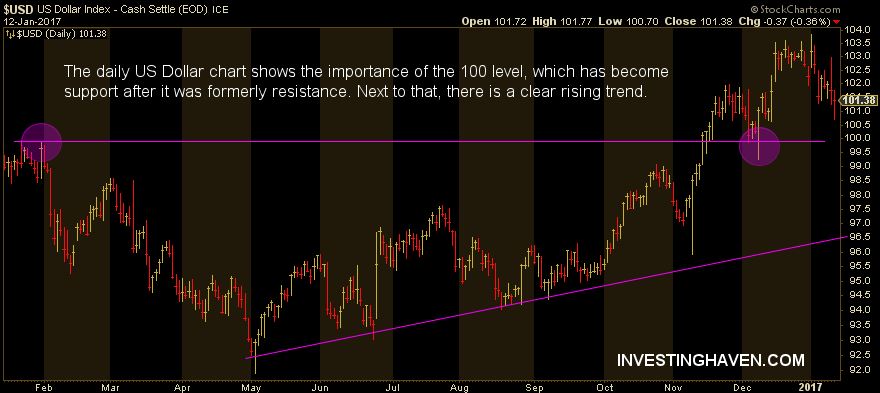
This year, however, the dollar started on a bearish note. Nothing goes up in a straight line, so a retracement in the dollar was in the cards. But until point exactly is a retracement still ‘normal’ and when does it become ‘really’ bearish. The line in the sand in the dollar index right now is the 100 level, and the next two charts explain why.
First, the daily chart shows how 100 was a strong resistance level a year ago, and it became support recently. A retest of support is normal, but a break below that would be the first bearish sign. Dollar bulls would really become concerned once the rising trend is broken, i.e. at 96.50.
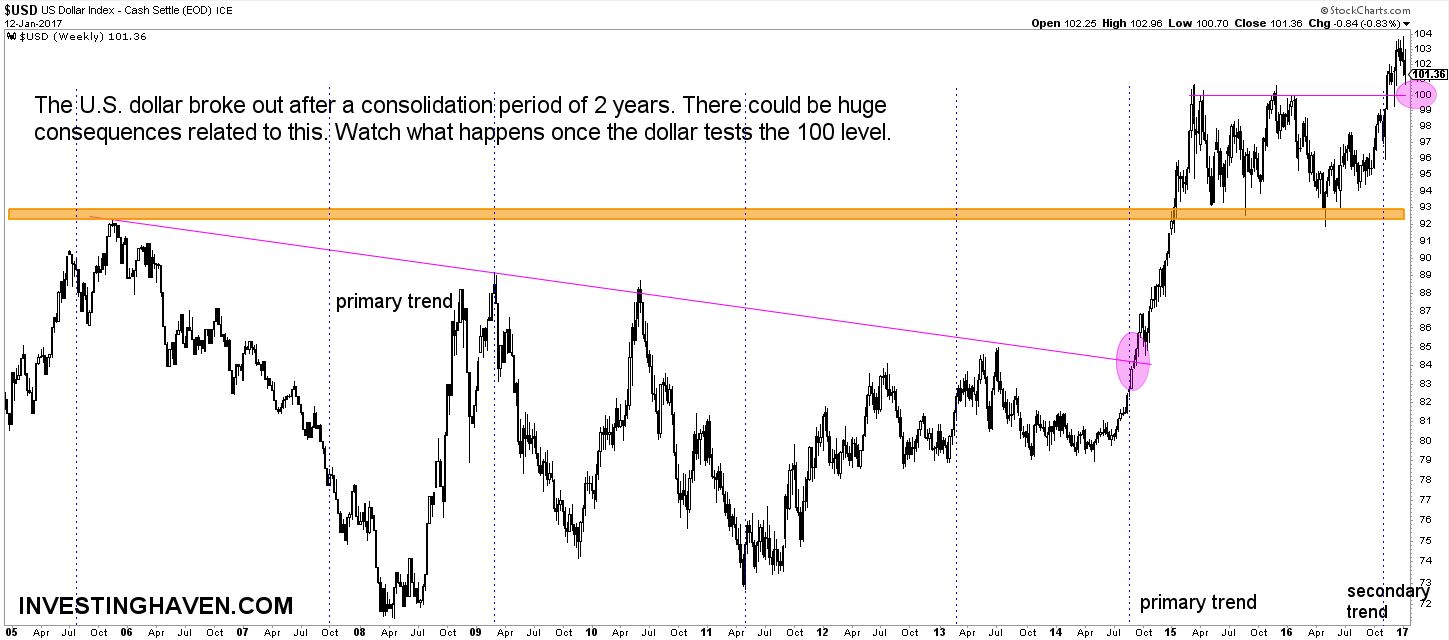
Furthermore, the weekly chart (see below) shows a much longer timeframe on which the importance of the 100 level is confirmed. The same conclusion from the daily chart above applies to the weekly.
The dollar is a very influential market globally. A trending dollar mostly impacts commodities, gold, and most currencies. What happens with ‘King Dollar’ around the 100 level could have significant consequences on several other markets. A bounce at 100 seems likely to us, in which case the breakout would be confirmed, but never exclude a bearish scenario.
Investors should watch very closely what happens in the dollar index in the coming few weeks.


