Investing Haven
No Result
View All Result
Gold Silver Investing >>
CRYPTO INVESTING >>
  • 2025 Forecasts
    • 10 market predictions
    • Dow Jones forecast
    • S&P 500 forecast 2025
    • Nasdaq prediction 2025
    • Best altcoins to buy
    • Best crypto to buy now
    • Which crypto will explode
    • 15 crypto forecasts 2025
    • Which precious metal to buy
  • Silver
    • Silver prediction 2025 – 2030
    • Will silver exceed $30?
    • When will silver hit $50?
    • Can silver hit $100?
    • Silver shortage
    • 50-year silver chart
    • Silver bullish reversal
    • Silver seasonality charts
    • How to invest in silver
  • Gold
    • Gold prediction 2025 – 2030
    • Will gold set new ATH?
    • Will gold hit $3,000?
    • Can gold hit $10,000?
    • Gold chart 10 years
    • Gold chart 50 years
    • Gold chart 100 years
    • Gold silver ratio
    • Gold seasonality charts
  • Commodities
    • Coffee forecasts
    • Sugar forecasts
    • Nickel forecasts
    • Lithium investing
  • Crypto forecasts
    • BTC prediction 2025 – 2030
    • ETH prediction 2025 – 2030
    • SOL prediction 2025 – 2030
    • XRP prediction 2025 – 2030
    • XLM prediction 2025 – 2030
    • BNB prediction 2025 – 2030
    • ADA prediction 2025 – 2030
    • AVAX prediction 2025 – 2030
    • KAS prediction 2025 – 2030
    • NEAR prediction 2025 – 2030
    • BCH prediction 2025 – 2030
    • LINK prediction 2025 – 2030
    • DOT prediction 2025 – 2030
    • SUI prediction 2025 – 2030
    • ICP prediction 2025 – 2030
    • LTC prediction 2025 – 2026
    • STX prediction 2025 – 2030
    • DOGE prediction 2025 – 2030
    • SHIB prediction 2025 – 2030
    • PEPE prediction 2025 – 2030
    • FLOKI prediction 2025 – 2030
    • WIF prediction 2025 – 2030
    • ONDO prediction 2025 – 2030
  • News
    • Crypto news
    • Commodities
  • Login
Investing Haven
No Result
View All Result

Home » Breakout / Breakdown » 5 Must-See Commodities Charts

5 Must-See Commodities Charts

Taki T. by Taki T.
November 28, 2023
in Breakout / Breakdown
crude oil price chart 2017
2k
VIEWS
Share on FacebookShare on Twitter

By far the most important market this week was crude oil. With a mini-crash of 12 percent it could spell the start of a new trend, potentially the start of turmoil in markets, as explained this week in crude oil falls 5 pct.

It is no coincidence that several other leading commodities are struggling as well, primarily gold and silver, copper and base metals.

However, this should not come as a surprise to our readers. We have spotted current trend reversal price levels many weeks or even months ago.

Nevertheless, we see that leading commodities have rather spectacular charts right now, so it is worth discussing them separately.

Crude oil could bring turmoil to global markets

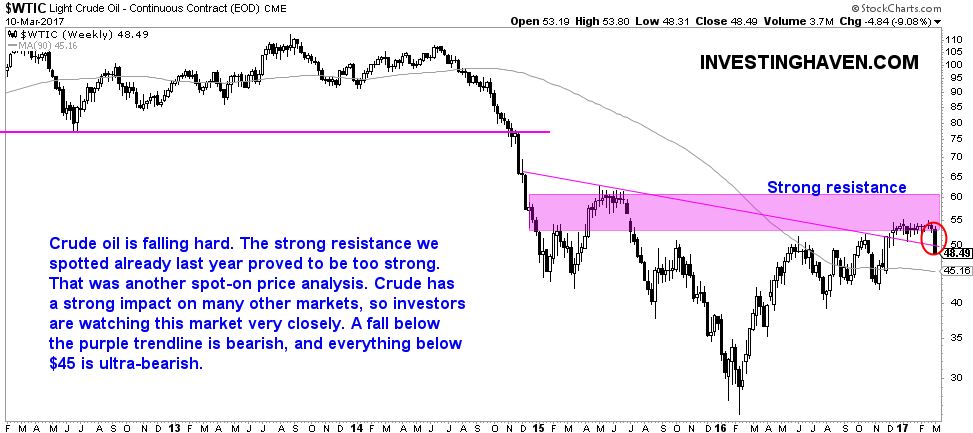
The ongoing mini-crash in crude oil is important because crude is a leading market. Once it starts trending, it has the power to influence all other markets globally. The crude oil crash of 2014 and 2015 are certainly proof of that.

Crude oil was visibly not able to break through resistance. We spotted this resistance area last summer, and since then crude did not succeed in going structurally above $52 which is the lower area of the resistance area seen on below chart. Our 2017 crude oil price forecast was spot-on.

InvestingHaven’s research team recommends to closely watch what happens in the $45 to $48 price range, as that has an above average importance to markets.

crude oil price chart

Precious metals continue their downtrend

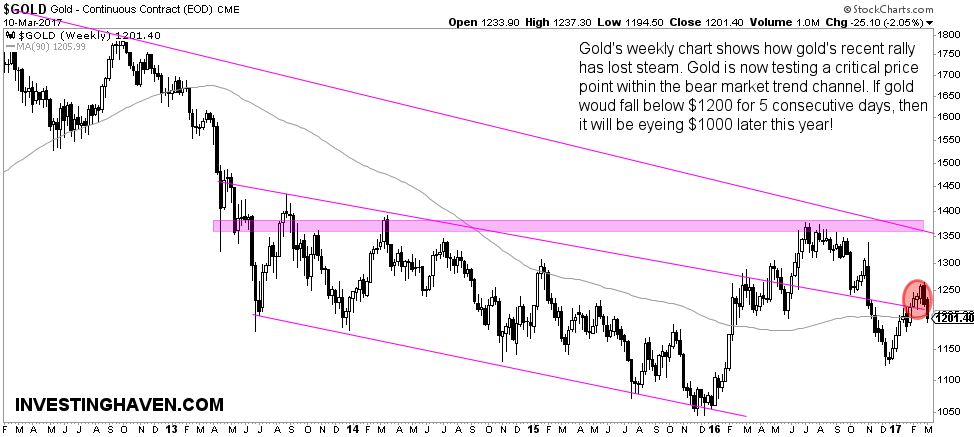
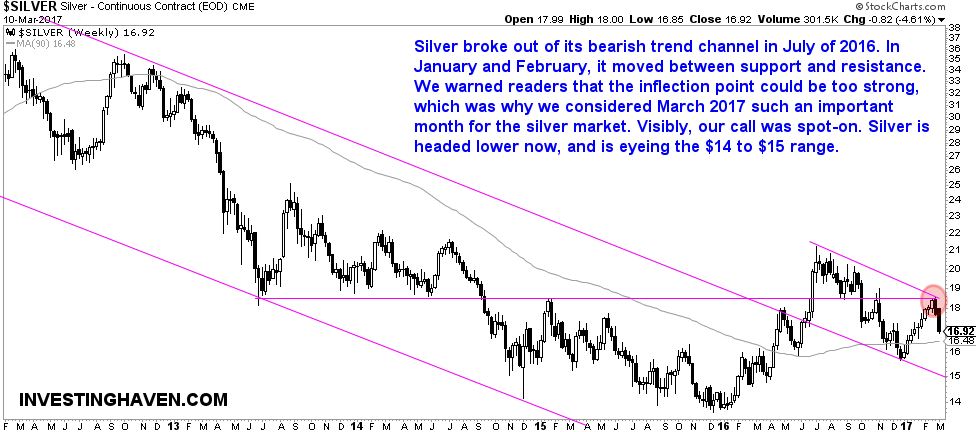
Gold (GOLD) and silver are both suffering as crude oil declines. Note on silver’s chart how the price of silver tested a secular breakout level but was unable to break above it. That happened right at a time when crude oil topped, and when gold was testing the above average important $1250 price level. We spotted the importance of the $1250 gold price many months ago.

Given the current chart structures in both gold and silver, the trend is clearly down. First, because of the fact that both assets are still in a long term bear market. Second, because structural support is way below current price levels.

So far, InvestingHaven’s long term price targets are still in play, as defined many months ago in our 2017 gold forecast and silver forecast 2017.

gold price chart

silver price chart

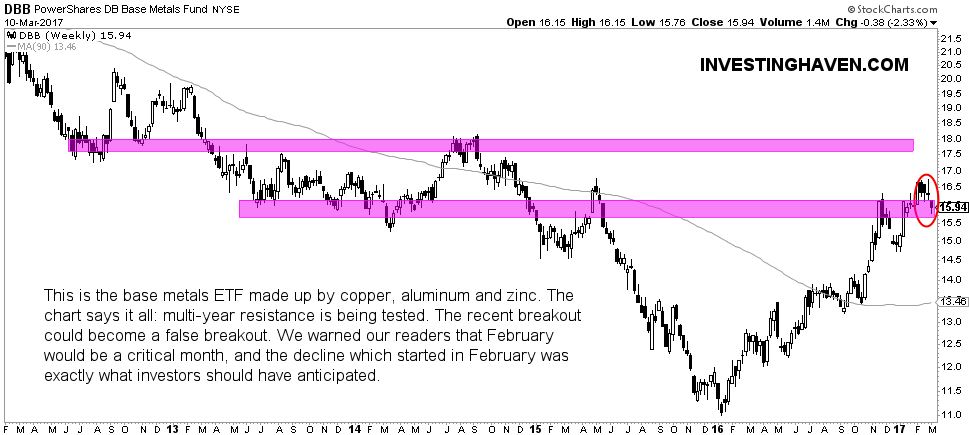
Base metals at critical juncture

Next, base metals have lost some 10 percent in recent weeks. InvestingHaven’s analysts flashed a warning a while back, explaining why February 2017 was crucial for base metals. The chart structure combined with an above average rise in 2016 were the two reasons to recommend prudence.

The DBB ETF, representing copper, aluminium and zinc, is now trading at a critical juncture. Any break below current levels would be bearish, and below 14.50 would be ultra-bearish.

Specifically to copper investors, we recommend re-reading our copper price forecast for 2017 as the price levels outlined in that article are still very accurate, certainly if copper continues to trend lower. However, if the ongoing decline would stop, copper would enter a bull market once it structurally trades above $2.80.

base metals price chart

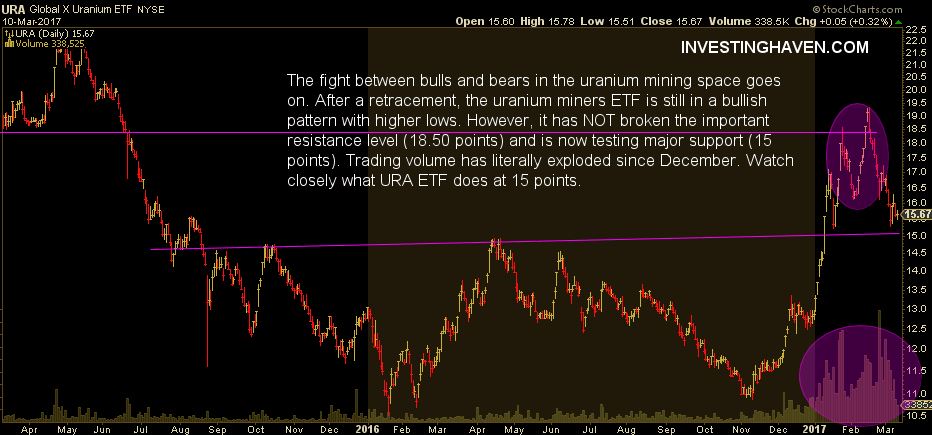
Uranium miners testing key breakout

The uranium space is the only one refusing to break down, at least for now. The 15 points level in URA ETF, representing the uranium mining space, is by far the most important price level to watch. Note on the URA chart how trading volume has exploded as prices started rising last December. There was bullish momentum in the uranium space, the key question is whether bulls will win the battle, watch 15 points to get an answer on that question.

uranium miners price chart

10-YEAR ANNIVERSARY OFFER: InvestingHaven.com celebrates 10 years. Temporarily, you can enjoy a discount on our premium gold/silver and crypto reports. Or you can become a VIP member. Go to our anniversary deals >>
Receive our weekly newsletter.

premium service SP-500 premium service trade alerts premium service crypto teaser 

No related posts.

Tags: DBBGOLDSILVERUranium Miners URA ETFUSOWTIC
Taki T.

Taki T.

Taki is a chart analyst who is passionate about unlocking unique insights out the chart. While the vast majority of analysts remain focused on price analysis, Taki starts with timeline analysis and adds price analysis to this. In doing so, he developed a unique methodology to find opportunities in financial markets, across assets and markets.

Leave a Reply Cancel reply

Your email address will not be published. Required fields are marked *

Connect with InvestingHaven

Receive top notch forecasts for free.

*We hate spam as you do.

Site Navigation

  • RSS Feed
  • About us
  • Advertising
  • Sponsored Content Policy
  • Mission 2026
  • Sitemap
  • Privacy & Disclaimer
  • Terms of Service
  • Contact Us
investing haven logo

Precious metals market analysis including gold and silver price predictions. Crypto market analysis including highly accurate BTC ETH SOL XRP forecasts.

Copyright © 2025 InvestingHaven

Login to your account below

Forgotten Password?

Fill the forms bellow to register

All fields are required. Log In

Retrieve your password

Please enter your username or email address to reset your password.

Log In

Receive top notch forecasts for free.

*We hate spam as you do.

No Result
View All Result
  • News
  • 2025 Forecasts
    • 10 market predictions
    • Dow Jones forecast 2025
    • S&P 500 forecast 2025
    • Nasdaq prediction 2025
    • Best crypto to buy now
    • Which crypto will explode
    • Best altcoins to buy
    • 15 crypto forecasts 2025
    • Which precious metal to buy
  • Silver articles
    • Silver prediction 2025 – 2030
    • Will silver exceed $30?
    • When will silver hit $50?
    • Can silver hit $100?
    • Silver shortage
    • 50-year silver chart
    • Silver bullish reversal
    • Silver seasonality charts
    • How to invest in silver
  • Gold
    • Gold prediction 2025 – 2030
    • Will gold set new ATH?
    • Will gold hit $3,000?
    • Can gold hit $10,000?
    • Gold chart 10 years
    • Gold chart 50 years
    • Gold chart 100 years
    • Gold silver ratio
    • Gold seasonality charts
  • Commodities
    • Sugar forecasts
    • Coffee forecasts
    • Nickel forecasts
    • Lithium investing
  • Crypto news
  • Crypto forecasts
    • BTC prediction 2025 – 2030
    • ETH prediction 2025 – 2030
    • SOL prediction 2025 – 2030
    • XRP prediction 2025 – 2030
    • XLM prediction 2025 – 2030
    • BNB prediction 2025 – 2030
    • ADA prediction 2025 – 2030
    • AVAX prediction 2025 – 2030
    • KAS prediction 2025 – 2030
    • NEAR prediction 2025 – 2030
    • BCH prediction 2025 – 2030
    • LINK prediction 2025 – 2030
    • DOT prediction 2025 – 2030
    • SUI prediction 2025 – 2030
    • ICP prediction 2025 – 2030
    • LTC prediction 2025 – 2026
    • STX prediction 2025 – 2030
    • DOGE prediction 2025 – 2030
    • SHIB prediction 2025 – 2030
    • PEPE prediction 2025 – 2030
    • FLOKI prediction 2025 – 2030
    • WIF prediction 2025 – 2030
    • ONDO prediction 2025 – 2030
  • Premium Crypto Alerts
  • Premium services

Copyright © 2025 InvestingHaven