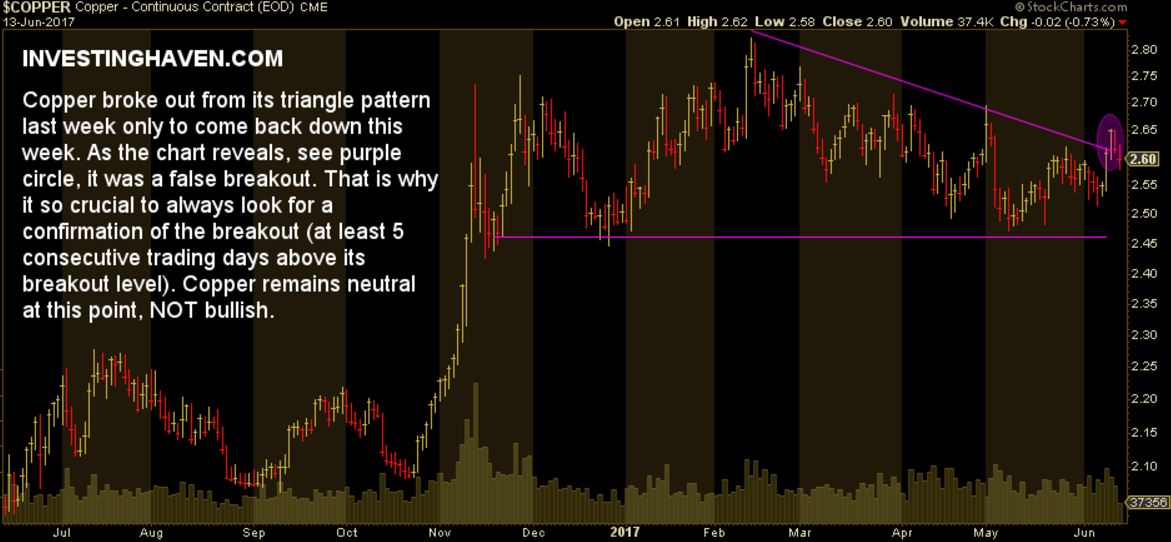
The price of copper looks very interesting. Just one week ago, it broke out from a triangle pattern that is in the making for more than 6 months. Several (respected) analysts became bullish because of that. We were not convinced, and gave the copper market the time it needed to confirm a new trend.
InvestingHaven’s research team appeared to be spot-on. The breakout, so far, has proven to be ‘false’. A ‘false breakout’ means that the price comes down again, after breaking out, and moves back inside its former pattern.
When it comes to the Copper Price, we have identified $2.50 as the key price level (the line in the sand). Once structurally above $2.50 it would suggest a bull trend is starting. As long as the price of copper remains below $2.50, it is either neutral or bearish.
For now, we remain convinced that the price of copper is neutral. The triangle pattern on below chart makes that point: between $2.45 and $2.60 there is simply no trend. Stated differently, copper is consolidating in the range we just indicated.
From an intermarket perspective, we see a Bearish Base Metals Forecast For 2017 unfolding. So that is definitely not helping copper. Moreover, commodities in general are certainly not in a bull market.
All in all, we remain firm that copper is neutral, and certainly NOT bullish at this point.


