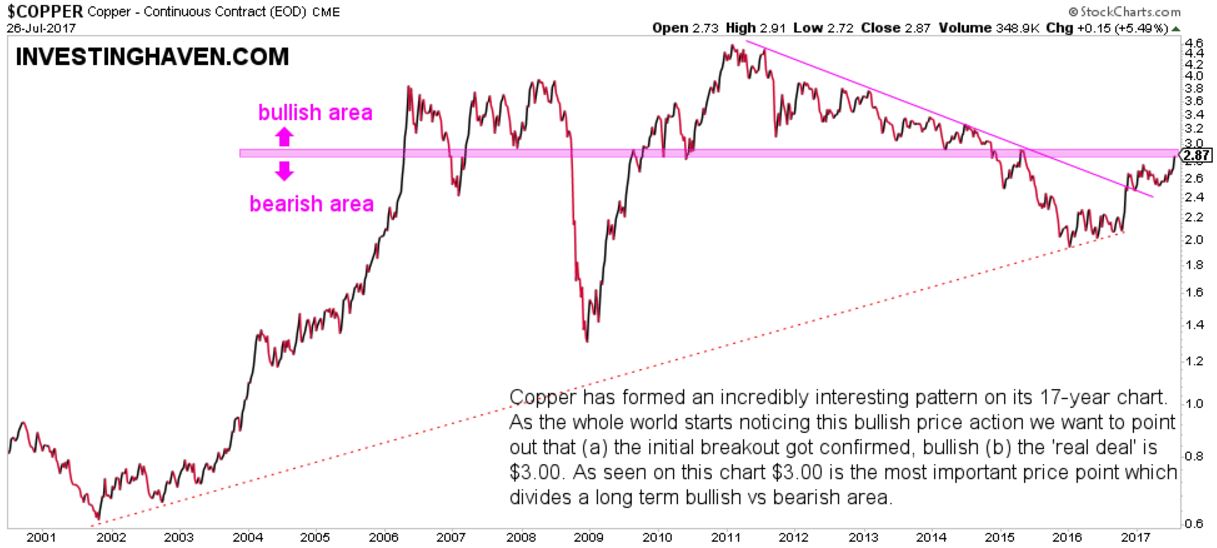
The price of copper (COPPER) has gone up strongly in recent days and weeks. The fact that many have noticed this, and that financial media are becoming ultra-bullish, is a sign of caution. Let’s take a look at the copper’s chart and do a sentiment analysis to conclude whether copper is bullish or bearish going forward.
Copper price bullish or bearish?
First, mainstream media has associated the price of copper as being bullish just because it hit 2-year highs. We would say there is no correlation whatsoever between both. A bullish or bearish outcome is the result of, first and foremost, long term trends on (very) long term price charts, followed by sentiment and some fundamentals.
It is imperative for investors to analyze long term charts. As seen on below chart, a 17-year chart, the ‘real deal’ is the area above $3.00 for obvious reasons. That is where the price copper enters a bullish area. Admittedly, the breakout above the falling (purple) trendline was a bullish event. But that is not sufficient.
From a sentiment perspective, it is clear there is a lot of excitement. Bloomberg calls the copper market red hot, while Reuters attributes copper’s recent surge to a positive Chinese economic outlook. We have the impression this is a bit over the top. Yes, copper is doing very well, very bullish, but, again, the $3.00 is the real start of a bull market.
From a fundamental perspective, we tend to agree that there could be a shortage in the copper market which is obviously bullish for copper. That is because the largest copper miners did cut their activities two years ago and last year, when commodities and the price of copper were crashing.
Freeport McMoRan (FCX) is a good leveraged play for the copper market, and it seems like our potential long term price targets for FCX are still in play. We would become bullish on FCX once copper crosses $3.00.


