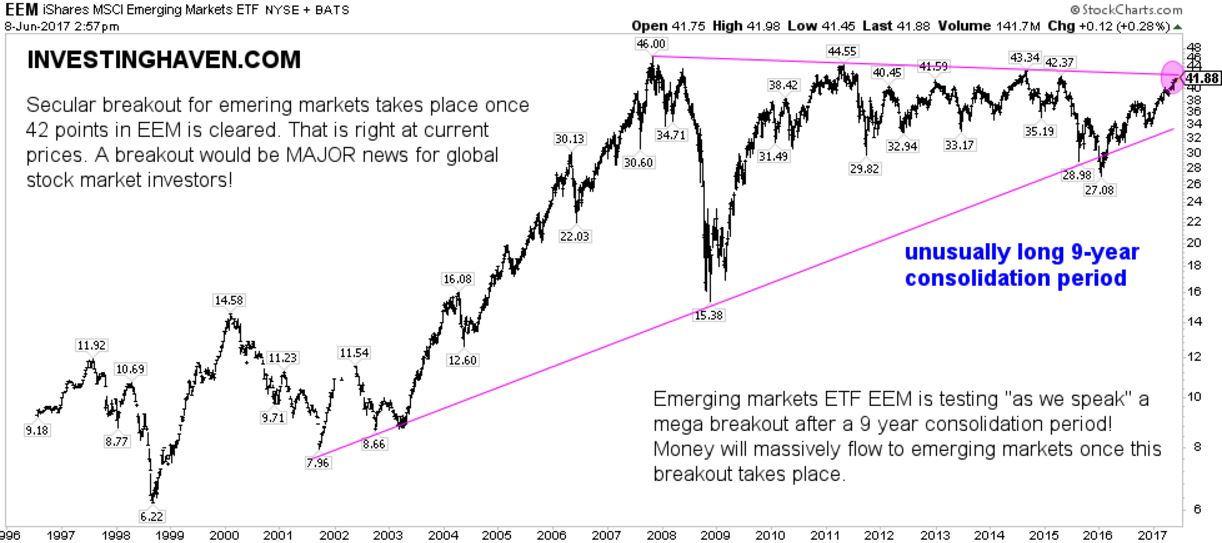
It is almost a fact. After we have been repeating, almost like a mantra, that emerging markets are the place to be in 2017 and 2018 for investors, the emerging markets index arrived at THE single most important price level on its chart: a secular breakout point.
As said many times before it is only an absolute minority of price points on a chart that do matter. The art of reading charts is to identify those meaningful price points. Drawing chart patterns are means to that end.
On the chart of emerging markets (EEM ETF) the most important price point is 42 points. Why? As the secular trendline (purple line) suggests this is the resistance of the consolidation which took an amazing 9 years will. As explained in our Emerging Markets forecast for 2017 we observed this already a year ago.
The consolidation setup seen on below chart is truly exceptional.
Smart investors know very well that the 42 point level is of the utmost importance. However, most investors have no idea about this insight. Financial media don’t know this neither. Most profits are made at the beginning of a new secular trend. The masses, however, will only find out about this secular bull market (provided it breaks out) once it stands 30 to 50 pct higher. That is the point where smart investors start taking profits.
InvestingHaven’s research team has examined the components of EEM, and concluded that two segments are exceptionally strong. First, the Indian Stock Market, and, second, China internet stocks. Both will do extremely well as EEM breaks out.


