
Energy stocks are in great shape. They are visibly setting up for a big move higher in 2018. This comes after a bullish crude oil price forecast for 2018 which we published almost half a year ago and already materialized.
After many months of basing the energy sector looks to be marching another step forward. This is partly assisted by the oil price breaking above previous resistance ~66.5. We are not interested with financial news about air strikes on Syria or Saudi’s further attempt to regulate the oil inventory, as that is pure noise for investors. Our purpose is to interpret what we see on the chart, as that is the only source of truth. As far as InvestingHaven’s team is concerned escalating oil price signals economic growth which coincides with the Fed’s decision to raise interest rate as documented in our previous report.
The most important representative energy ETF is Sector SPDR Fund XLE which is also one of the 9 major sub-sectors part in the S&P 500 index
This ETF offers exposure to the U.S. energy industry, including many of the world’s largest oil producers. While XLE probably doesn’t make sense for those constructing a long-term buy-and-hold portfolio, it can be potentially useful as a tactical overlay for those looking to shift exposure towards the energy sector. Compared to other energy options XLE is impressive both in terms of cost efficiency and liquidity. But like many funds offering exposure to the energy sector XLE maintains some concentration issue, as a few stocks account for big chunks of the total portfolio
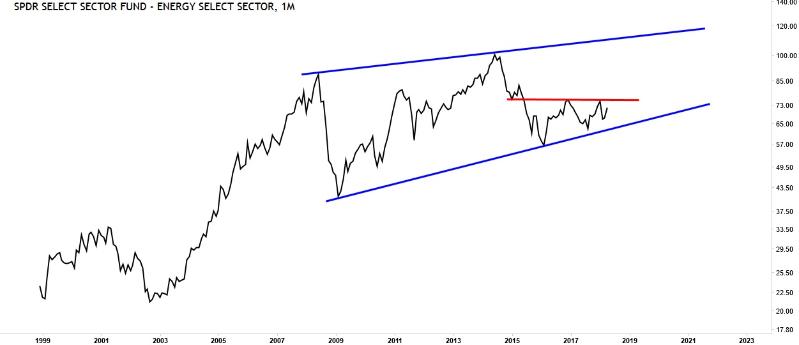
Monthly chart of XLE
XLE commenced its trading in Dec 1998. It experienced a little growth to 2000 and then retraced to a level slightly lower than its inception trading price. Ever since the bottom in 2003, XLE made an impressive run to the top of 2008 that coincided with the global financial crisis. That was followed by a sharp plunge during 9 months.
It was yet another impressive but more bumpy run from 2009 to marginal top that peaked in 2014. This price movement in its entirety is morphing into a massive rising pennant as shown by the two blue trendlines. Since July 2015 price has been consolidating as a small ascending triangle (upper resistance line marked red). Should price break above the red resistance zone it will be more or less a full fledge bullishness in energy stocks. And we anticipate XLE (XLE) to move higher than that. That said, a break below the lower blue trendline will change the bullish outlook into a bearish outlook.
These are 4 energy stocks to buy in 2018, and worth holding for mid to long term.
Energy stocks in 2018 #1 – Exxonmobil Corporation (NYSE: XOM)
Exxon Mobil Corporation (ExxonMobil) is an American multinational oil and gas corporation headquartered in Irving, Texas. It is formed on November 30, 1999 by the merger of Exxon (formerly the Standard Oil Company of New Jersey) and Mobil (formerly the Standard Oil Company of New York). This company needs no introduction because it engages in entire spectrum of oil and gas activities from upstream (exploration and production), midstream (processing, storing, transporting and marketing of oil, natural gas and natural gas liquids) to downstream (refining and sales)
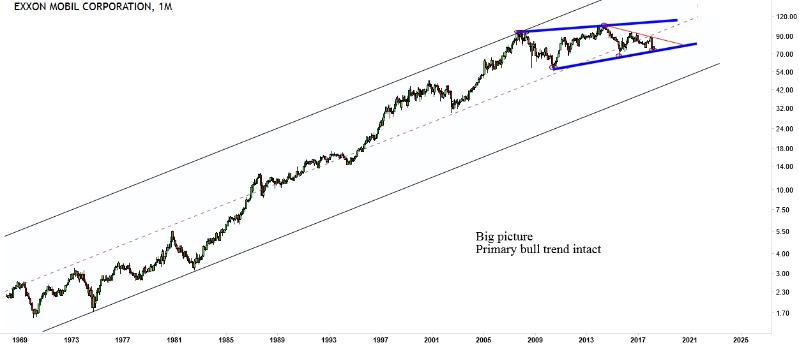
Monthly chart of Exxonmobil
The historical chart of XOM since inception depicts a rock solid primary trend.
Since the top in 2007 price has been moving in a somewhat upward tilting pennant for 11 years. After finding support for the third time at the lower blue trendline this stock is poised to drift higher. As long as the price doesn’t break below the lower blue trendline we will remain neutral with a bullish bias in which case XOM will likely challenge 105.
Energy stocks in 2018 #2 – Chevron Corporation (NYSE: CVX)
Chevron is another major competitor of Exxonmobil, and it does not need any introduction.
![]()
Monthly chart of Chevron
The historical line chart of Chevron is well inside a solid primary uptrend channel. Unlike the chart of XOM, it behaves more cyclically with big up and big down at certain intervals. At the current price level, price looks set to challenge the previous resistance marked by the blue zone. Ability to break above 135 will depend partly on how the crude oil price will move. Breaking this 135 level will mean higher upside, while another rejection by 135 will mean triple top and possibility another lengthy consolidation down.
Energy stocks in 2018 #3 – ConocoPhillips Company (NYSE: COP)
ConocoPhillips Company is an American multinational energy corporation with its headquarters located in the Energy Corridor district of Houston, Texas in the United States. It is the world’s largest independent pure-play exploration and production company and is a Fortune 500 company ConocoPhillips was created through the merger of American oil companies Conoco Inc. and Phillips Petroleum Co. on August 30, 2002. In 2012, ConocoPhillips spun off its midstream and downstream assets as a new, and separate company, Phillips 66 (NYSE: PSX)
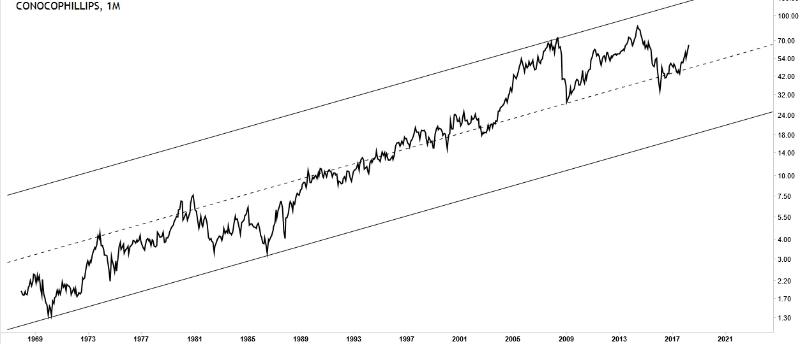
Monthly chart of COP
It is without a doubt that this rock solid oil and gas company continues to move in a multi year uptrend channel. Similar to Exxonmobil, price has been consolidating for ten years since reaching the top in 2008. It is now in the process of making a potential W pattern. We are confident that this stock will attempt to challenge at least 87.5. Subsequently, the ability to break above this level would imply a full fledge bullish scenario while a rejection implies more consolidation is needed. In case its price breaks below the median line the mid term outlook becomes bearish.
Energy stocks in 2018 #4 – Suncor Energy (NYSE: SU)
Suncor Energy is a Canadian integrated energy company based in Calgary, Alberta. It specializes in production of synthetic crude from oil sands. Suncor ranks number 134 in the Forbes Global 2000 list. Until 2010, Suncor marketed products and services to retail customers in Ontario through a downstream network of 280 branded as Sunoco, and 200 customer-operated retail and Diesel fuel sites. Following the acquisition of former Crown Corporation Petro-Canada, Suncor converted its Sunoco stations (which were all in Ontario) to Petro-Canada sites in order to unify all of its downstream retail operations under the Petro-Canada banner throughout Canada. It also enabled the company to discontinue paying licensing fees for the Sunoco brand to Sunoco Inc. in the United States. Nationwide, Petro-Canada’s upstream product supplier and parent company is Suncor Energy. Suncor also markets through a retail network of Shell, Exxon, and Mobil branded outlets in Colorado. It is also listed in NYSE.
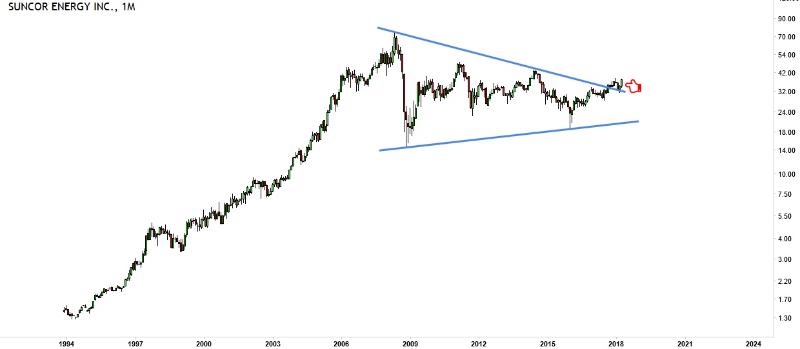
Monthly chart of Suncor Energy
Suncor has an interesting price chart. It has never experienced a big hiccup since 1994, until the 2008 global financial crisis halted its exponential price movement. It has the fastest recovery amongst all its peers, it needed only 5 months to bottom! Subsequently price has been consolidating into a symmetrical triangle. Price broke the upper triangle trendline in Sept 2017 but swiftly retraced to test the strength of support. So far it has been holding well, and is poised to go higher. Conservatively, we anticipate price to challenge 43 and 48 by end of 2019. Whether or not this will materialize, getting back to 73 will be hard. The bearish scenario will play out once price breaks below the upper triangle line.
Oil is one of the macro-fundamental leading indicators of economic growth and inflation. Oil related stocks will be most sensitive to oil price moves. Investor can make big profits if the crude oil price will rise, and if they continue to hold their energy stocks knowing that this sector is characterized by huge volatility. That said, due diligence is compulsory for readers who want to invest in oil stocks as this is not a buy or sell recommendation.


